
Strava fitness graph is bogus

  • September 3, 2023
  • 17 replies
  • 779 views

Silentvoyager
Superuser
Forum|alt.badge.img+26

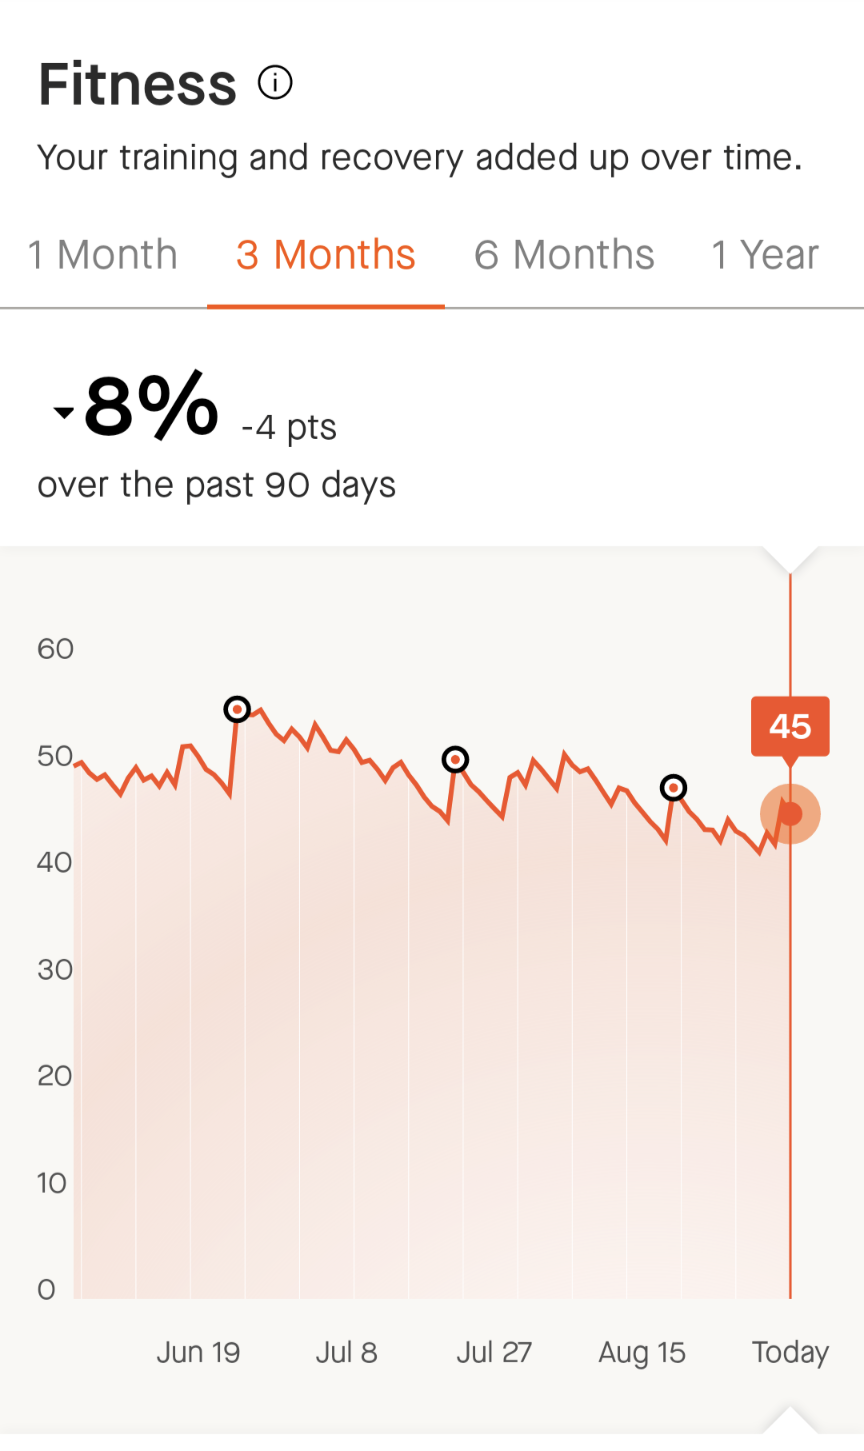
This is my fitness in the last 3 months according to Strava as I am training for an upcoming 100 miler. In reality this couldn't be any further from truth. My aerobic fitness went up significantly. I handle heat much better than 3 months ago, and I recover quickly from long training runs.

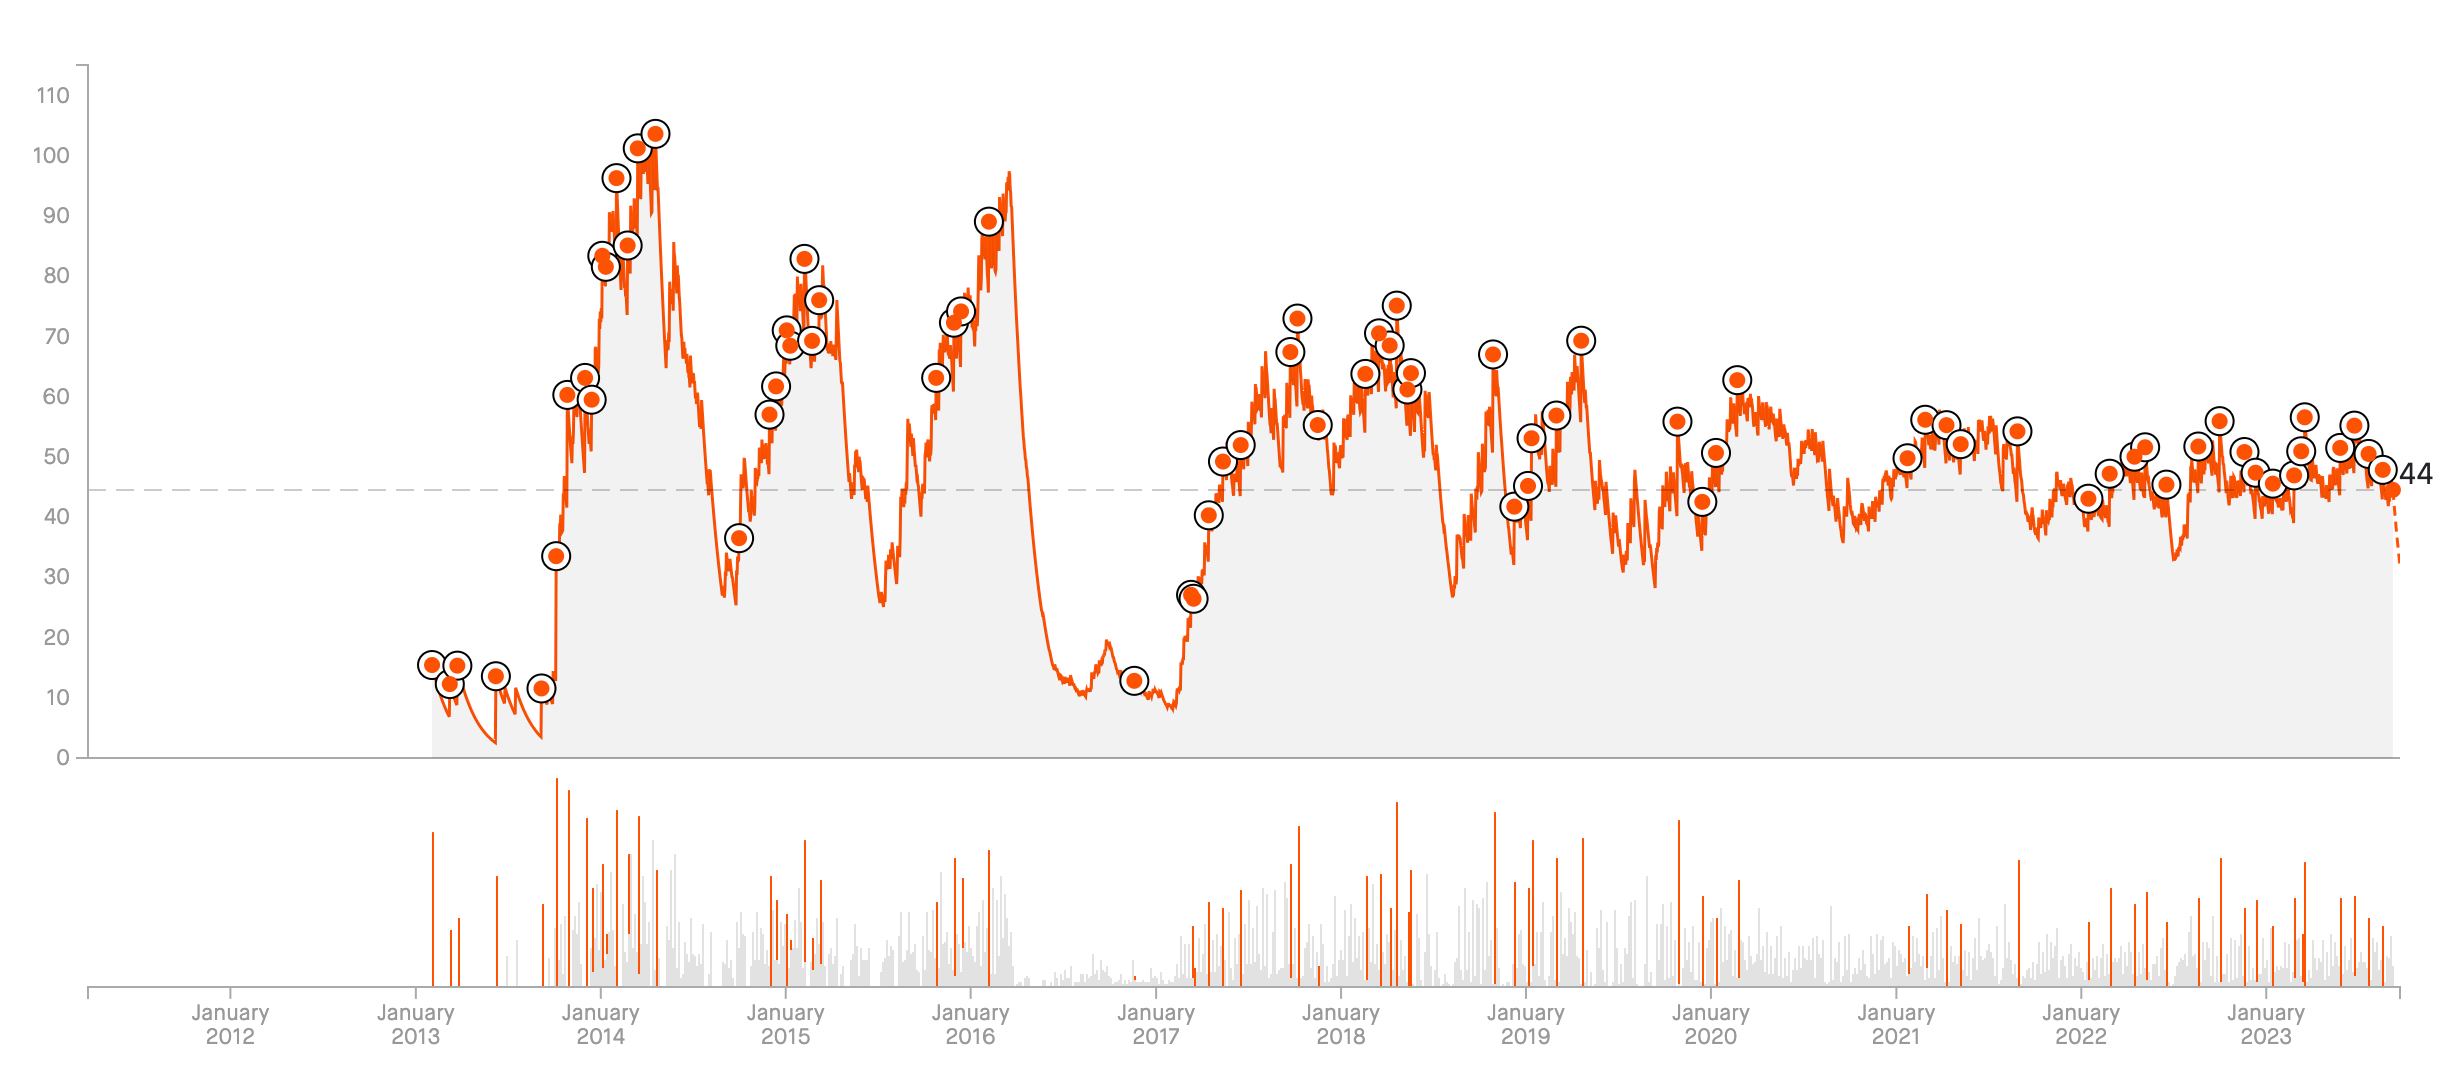
What Strava calls fitness is highly misleading. This should be called something like acute training load as this gives a lot of emphasis on time spent in high intensity. But that isn't fitness as people who end up training too hard (at too high intensity) all the time tend to plateau. This doesn't encourage to train smart and only works to reflect noob gains for people who have just started exercising. 

Also consider the fact that the biggest gains in "fitness" on this graph are from finishing races. But again that is false. Running a long distance race in fact suppresses fitness for a few weeks as the body needs to recover from a higher than usual stress. 

17 replies

Forum|alt.badge.img+6
  • Hub Rookie
  • September 8, 2023

I like Strava's effort here, but your points are good.Maybe it would help to add in some sort of VO2max calculation, like Garmin provides. I'm sure there are hundreds of trainers on Strava that could give input to improve this charting.


Jan_Mantau
Superuser
Forum|alt.badge.img+27
  • Superuser
  • September 8, 2023

@Silentvoyager  The term fitness is indeed misleading but unfortunately it's the established wording in sport science for showing how much do you train at your limits. Another word for it is "Chronic Training Load", which means exactly the same. The graph matches your description of your training, because it's all relative to your abilities. When you get better your heart rate isn't so often in the red zones. That means you didn't train as hard as before from a cardiovascular point of view.


Silentvoyager
Superuser
Forum|alt.badge.img+26
  • Author
  • Superuser
  • September 8, 2023

Yes, I understand exactly what this graph means. I'd still argue that it confuses a lot of users. I can't tell you how many https://www.reddit.com/r/Strava/ posts I commented on about this graph. Perhaps it is terminology but I'd insist it shouldn't be called "Fitness" because it doesn't reflect fitness. And if someone wants this graph to keep going up they need to exercise harder and harder which would inevitably lead to a burnout.

Here is my graph for the last 10 years (apparently I can see that on the website):

If you look at years 2014-2016, I used to train hard all the time so my average HR was way higher than it is now, so the impact on this graph was higher. According to this graph, at the peak in 2014-2016, my fitness was 2x higher. But that isn't true. Currently, despite being 10 years older, my VO2max is higher and I can sustain higher volumes of training. I am faster on uphills. And, also, I've just set a PR on a fast 50km race course - one that requires to sustain speed over multiple hours - the same that I ran in 2014. In fact, looking at the Training Impulse for exactly the same race - in 2014 it was 729 and this year it was 531 - that is despite the fact that I finished that race faster this year and set a 50k PR. So does that actually reflect fitness?

Now, if you look at the beginning of 2016 - where the graph went down sharply. That was a real burnout - an overtraining that caused serious health issues and landed me in a hospital, and took a long time to recover from. That's what training at a higher intensity all the time may lead to.

Could I use a bit more high intensity training? Absolutely! Would that be reflected in the graph? Perhaps. But my main point is that what this graph shows is not fitness and that trying to keep going higher all the time would encourage bad training patterns and lead to a burnout.


Jan_Mantau
Superuser
Forum|alt.badge.img+27
  • Superuser
  • September 8, 2023

I agree, it shouldn't be called fitness just because the scientists came up with this completely misleading word. Trainingspeak and other platforms use CTL for Chronic Training Load instead, that would need explanations for the users too but at least nobody would think this graph reflects if they got better or worse.

In the Strava browser the fitness/freshness graph can display the "form" too, event that word is misleading but it's a useful indicator if someone is near overtraining if it's to deep in the minus. This should be displayed in the app too and in both cases not only on demand as this indicator is more useful as the "fitness".


Forum|alt.badge.img+2
  • Hub Starter
  • February 13, 2024

I fully agree! The fitness chart is just an activity log. It really doesn’t accept recovery as part of training plan. I do long/slow runs in prep for ultra distances and Strava really doesn’t really seem to understand. 
 I was hoping it would be more useful. 


Forum|alt.badge.img+2
  • Hub Starter
  • March 17, 2024

Thanks for posting this. I whole heartedly agree.  This graph promotes overtraining. 


Forum|alt.badge.img+4
  • Hub Starter
  • March 17, 2024

No question, of all the “features” in Strava, this measure of fitness is 100% the most useless and misleading. 


Forum|alt.badge.img+4
  • Hub Starter
  • March 17, 2024

No question, of all the “features” in Strava, this measure of fitness is 100% the most useless and misleading. 


Forum|alt.badge.img+2
  • Hub Starter
  • March 17, 2024

This needs to be changed. My fitness has apparently dropped 12% in the past 12 months yet 1 year ago I ran a 4.04 marathon and a 1.47 HM. Within the last 2 weeks I’ve run a 1.28 HM and a 3.18 marathon and my fitness has dropped??!! 


Forum|alt.badge.img+2
  • Hub Starter
  • March 18, 2024

Absolutely useless feature, this is why I will not continue my subscription this year. I have high intensity weight trainings which are like 90 mins and my simple commute ride to the office (~30 minutes) generate 3 times more relative effort then my weight trainings. It is a joke. I use a proper chest HR every time, my avg is 120 and max is 150, but gives me less than a long walk.


Forum|alt.badge.img+1
  • Hub Starter
  • July 6, 2024

Chronic Training Load also does not reflect “fitness”. It is simply a metric that tracks the amount of training you are doing. “Fitness” is a totally general term that has no specific  meaning in sports science, but for us quite  obviously is attached to a specific task/goal…ie are we fit enough to achieve a specific performance goal. Strava takes no account of that; the fitness number is useless. CTL is simething completely different.


Forum|alt.badge.img
  • Hub Starter
  • December 16, 2025

I have read your comments here. Until Sunday, I used the Fitness Fatigue Form as a guide to get me ready for events including long distance 

It worked well until Sunday when I rode 100kms on zwift with a high level group and hung on by my fingernails, and as with the others used the x4 Coffee breaks of 3 minutes every 35 minutes. The training intesity both on Zwift and Strava was Epic and intensity Historic 495 respectively!!

BUT my Fitness only increased by x1 notch and my fatigue was not affected (yet my leg muscles were completely exhausted) 

Today, 48 hours later, I did my 60km fat burner external ride comfortably and it was indicated as intensity 370 on the Event description, AND my Fitness increased by 9 points ! and my fatigue significantly also increased much more than the previous event.

I have no idea why Strava recognises a very intense and tiring Zwift event on its event summary, and literally ignores it on the Fitness measure. Really makes no sense and has blown my confidence in the reliability of the app. I may have to go to Garmin,…..


Forum|alt.badge.img
  • Hub Starter
  • December 16, 2025

Absolutely useless feature, this is why I will not continue my subscription this year. I have high intensity weight trainings which are like 90 mins and my simple commute ride to the office (~30 minutes) generate 3 times more relative effort then my weight trainings. It is a joke. I use a proper chest HR every time, my avg is 120 and max is 150, but gives me less than a long walk.

I agree with your frustration, I have high intensity long duration events its Fitness metric does not recognise and lower intwnsity 60k rides that it does recognise. The programmers need to talk to some sports doctors!!


Forum|alt.badge.img
  • Hub Starter
  • December 16, 2025

Yes, I understand exactly what this graph means. I'd still argue that it confuses a lot of users. I can't tell you how many https://www.reddit.com/r/Strava/ posts I commented on about this graph. Perhaps it is terminology but I'd insist it shouldn't be called "Fitness" because it doesn't reflect fitness. And if someone wants this graph to keep going up they need to exercise harder and harder which would inevitably lead to a burnout.

Here is my graph for the last 10 years (apparently I can see that on the website):
3266i5058D5886DDC5EC0.png

If you look at years 2014-2016, I used to train hard all the time so my average HR was way higher than it is now, so the impact on this graph was higher. According to this graph, at the peak in 2014-2016, my fitness was 2x higher. But that isn't true. Currently, despite being 10 years older, my VO2max is higher and I can sustain higher volumes of training. I am faster on uphills. And, also, I've just set a PR on a fast 50km race course - one that requires to sustain speed over multiple hours - the same that I ran in 2014. In fact, looking at the Training Impulse for exactly the same race - in 2014 it was 729 and this year it was 531 - that is despite the fact that I finished that race faster this year and set a 50k PR. So does that actually reflect fitness?

Now, if you look at the beginning of 2016 - where the graph went down sharply. That was a real burnout - an overtraining that caused serious health issues and landed me in a hospital, and took a long time to recover from. That's what training at a higher intensity all the time may lead to.

Could I use a bit more high intensity training? Absolutely! Would that be reflected in the graph? Perhaps. But my main point is that what this graph shows is not fitness and that trying to keep going higher all the time would encourage bad training patterns and lead to a burnout.

Excellent Analysis. So what you are saying is that this algorithm and its description is potentially not just misleading but dangerous. Surely Strava has done something about this in recent months before it lands them in court?

I have been using this metric,….and have just found that the effort Strava records for the actual event does not relate to the fitness parameter and more importantly not to the fatigue and overtraining parameter. I would like Strava to respond to this please? 


Forum|alt.badge.img
  • Hub Starter
  • December 16, 2025

No question, of all the “features” in Strava, this measure of fitness is 100% the most useless and misleading. 

I would say this form of graph would be very useful if it also accounted for FTP and Vo2Max,…...so it would account for your improved cardiovascular fitness (hence lower heartbeat for the same power output) as an improvement. From my recent results I have lost confidence on the usefulness of this feater,...and as a result Strava. 


Jan_Mantau
Superuser
Forum|alt.badge.img+27
  • Superuser
  • December 16, 2025

No question, of all the “features” in Strava, this measure of fitness is 100% the most useless and misleading. 

I would say this form of graph would be very useful if it also accounted for FTP and Vo2Max,…...so it would account for your improved cardiovascular fitness (hence lower heartbeat for the same power output) as an improvement. From my recent results I have lost confidence on the usefulness of this feater,...and as a result Strava. 

If you have a power meter then Strava will use that and the FTP for calculating the standard “fitness” graph. And I would guess the difference between your Zwift and external ride occured because Zwift rides have power readings and your outdoor ride didn’t.

Anyway, if you are on the web interface you can switch the fitness graph between “Relative Effort” and the default “Power & Relative Effort”. If you use “Relative Effort” I bet you would see the heavy impact of the Zwift ride.


Forum|alt.badge.img
  • Hub Starter
  • December 16, 2025

No question, of all the “features” in Strava, this measure of fitness is 100% the most useless and misleading. 

I would say this form of graph would be very useful if it also accounted for FTP and Vo2Max,…...so it would account for your improved cardiovascular fitness (hence lower heartbeat for the same power output) as an improvement. From my recent results I have lost confidence on the usefulness of this feater,...and as a result Strava. 

If you have a power meter then Strava will use that and the FTP for calculating the standard “fitness” graph. And I would guess the difference between your Zwift and external ride occured because Zwift rides have power readings and your outdoor ride didn’t.

Anyway, if you are on the web interface you can switch the fitness graph between “Relative Effort” and the default “Power & Relative Effort”. If you use “Relative Effort” I bet you would see the heavy impact of the Zwift ride.


Thank you Jan, that is a concise and very useful response. I have moved it from Power and Relative Effort to Relative Effort and yes,...I can see the significant impact of Sundays ride. I will also get a Power Meter on my Scott for the external rides. I need to see my FTP and Power improvements consistently, nit just on Zwift/Tacx Neo, and then I will switch back for a more consistent overview.