
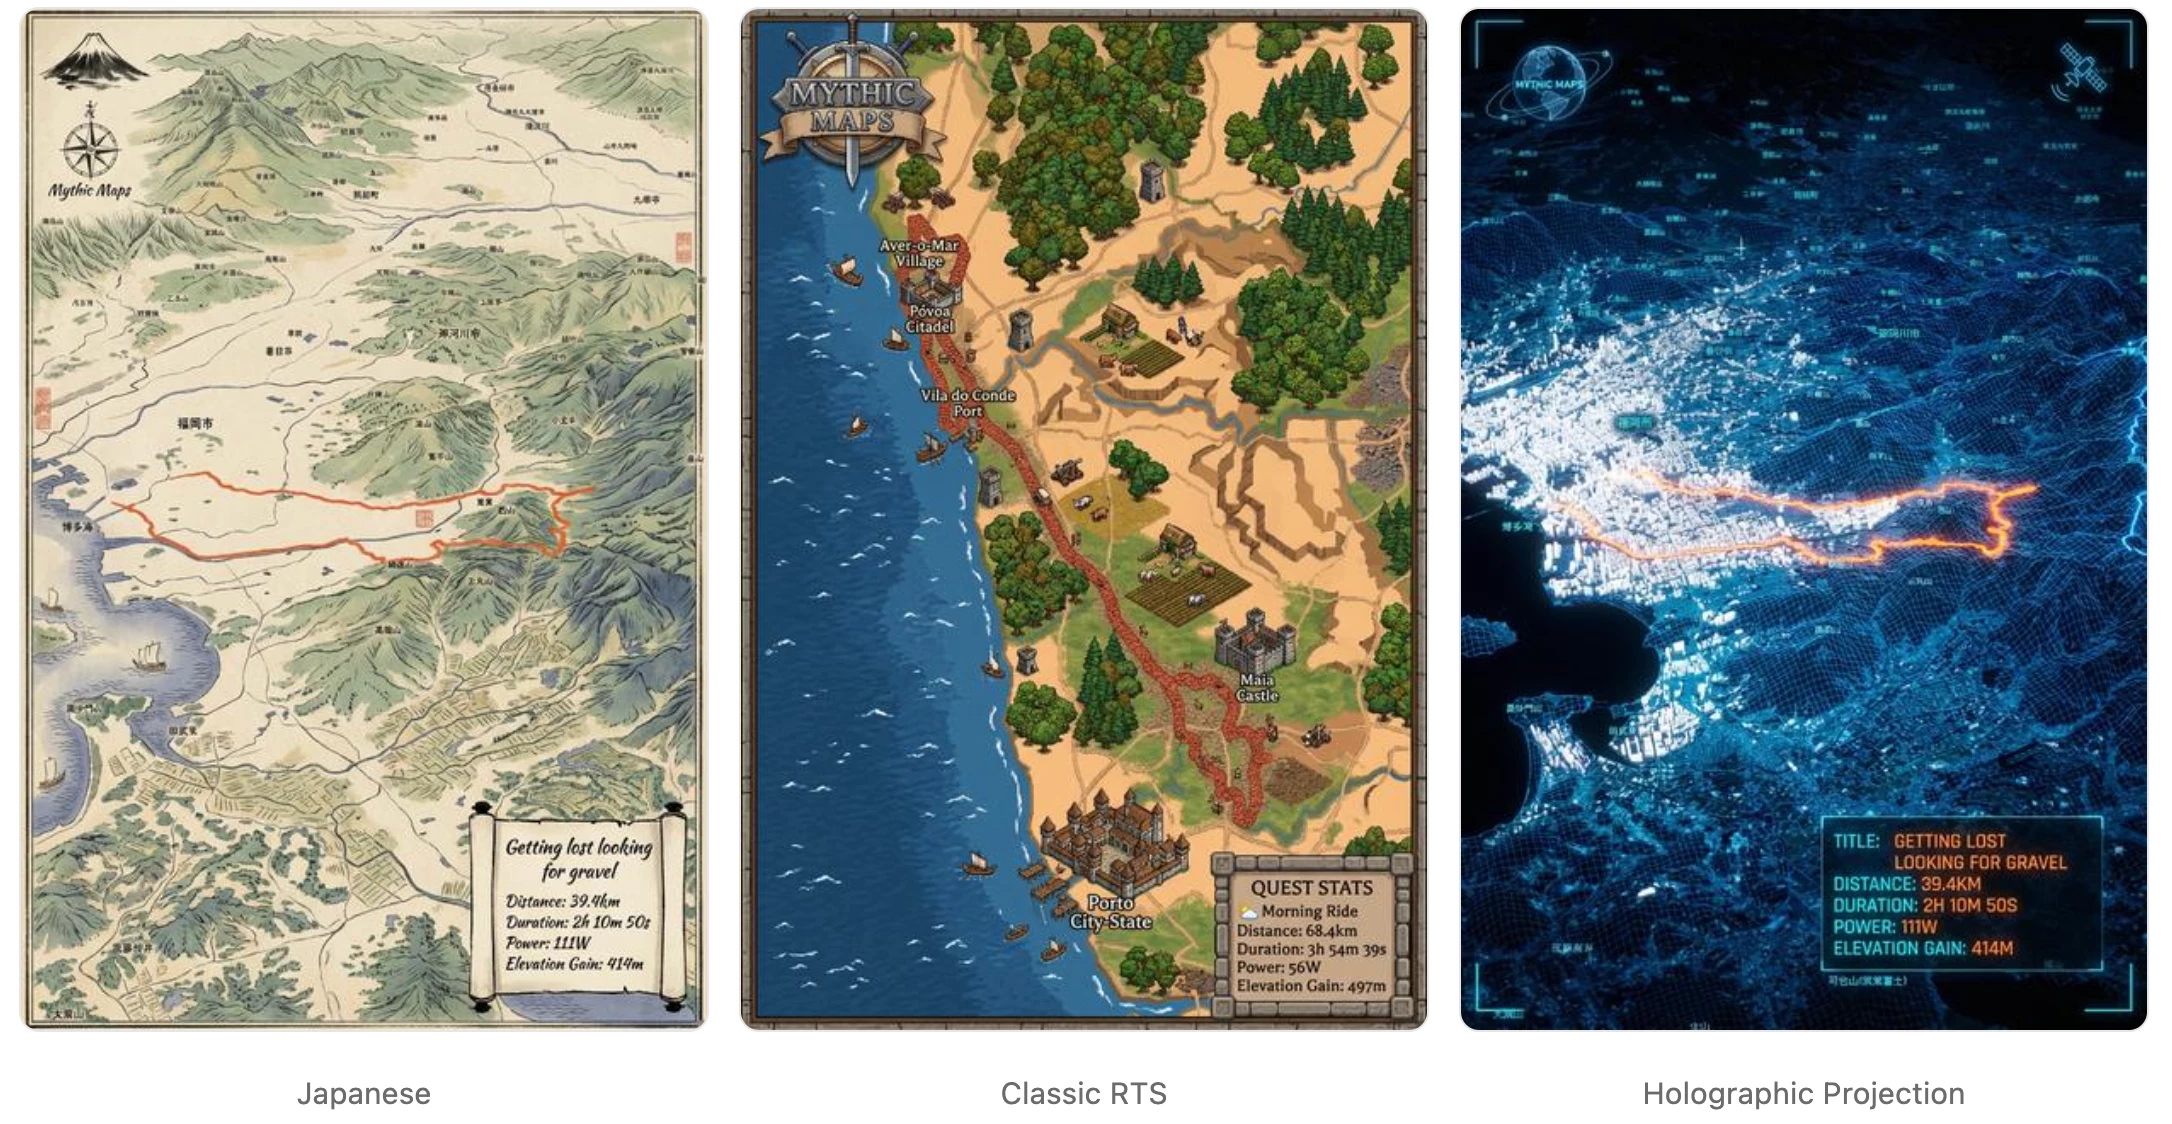
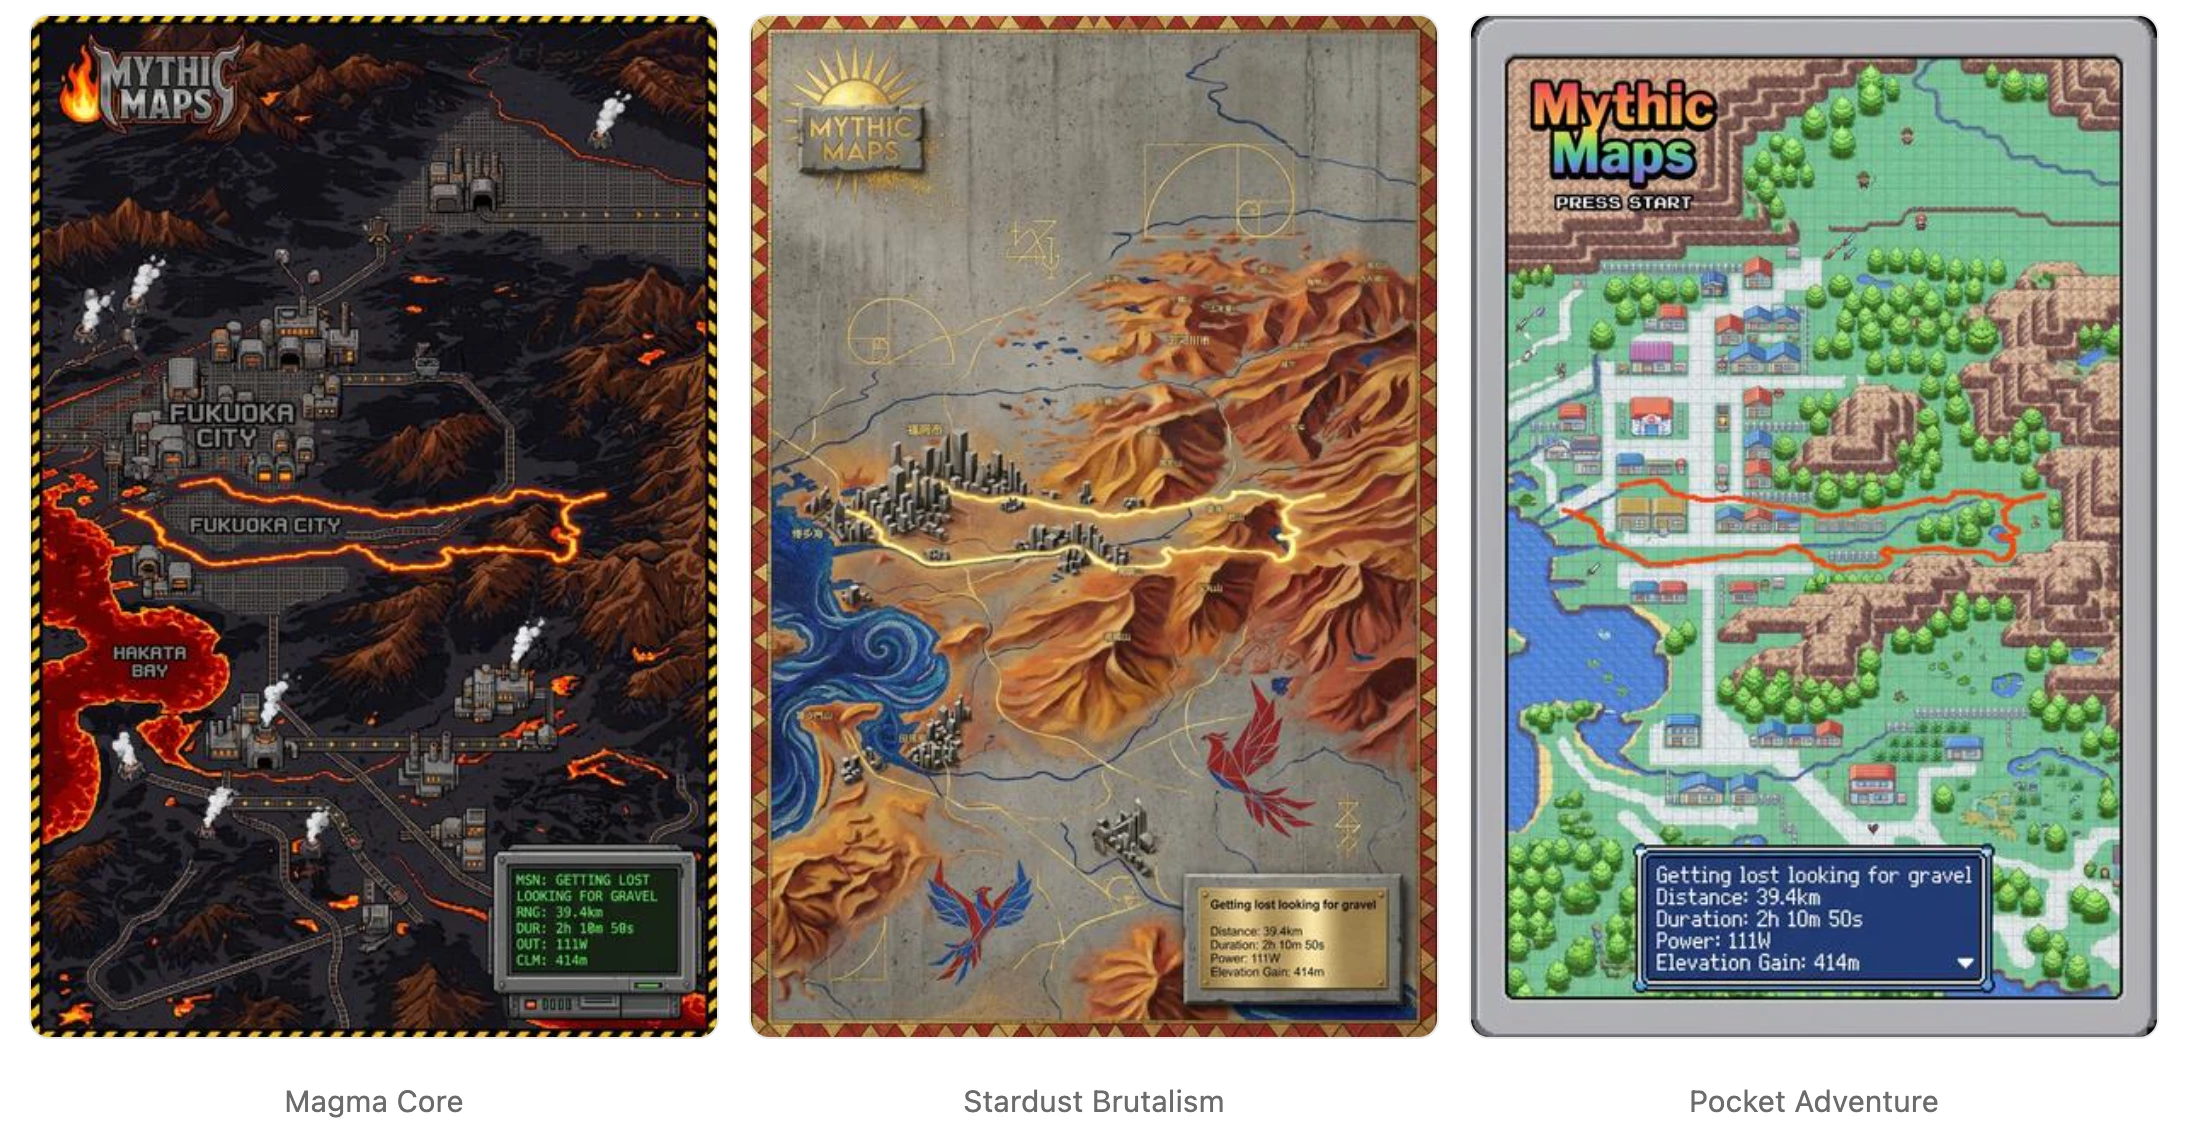
Mythic Maps takes your Strava activities and turns them into stylized, illustrated maps. You connect your account, pick a ride or run, choose a visual style, and we generate a map. Not a filtered overlay on the standard Strava view, but a fully illustrated world built around your GPS route, in styles ranging from Edo-period Japanese ink painting to pixel-art RPGs to holographic tactical displays.
Some styles are 2D, some are 3D, but the 3D ones introduced a specific technical problem very early on: once you tilt the map, camera choice matters as much as the route itself.
A random bearing and pitch will often produce a bad result. Terrain can hide part of the line. The route can get pushed too close to the edge of the frame. A long climb can compress into something visually flat. Even when the activity is great, the map can look weak.
So for us, 3D generation became a search-and-evaluation problem. We are not searching for a new route. We are searching for the best camera for a route the athlete has already done. This system runs on both full activity routes and individual Strava segments.
Start With the Strava Geometry
Once a user picks an activity, we decode Strava's encoded polyline into coordinates and load it into Mapbox as a LineString. If they are generating from a segment, we use the segment polyline instead. We then enable terrain using Mapbox DEM data with a terrain exaggeration of 1.5.
At that point we render the route twice: the visible route line the user will see, and a hidden magenta probe line, drawn wider than the visible route, used only for scoring.
That second line is the key to the whole system. Rather than trying to estimate visibility analytically, we score against the rendered output. If terrain or framing causes the route to disappear in the actual image, we want the scorer to see that.
Candidate Generation
We begin by estimating the route's dominant orientation from its principal axis. If that becomes degenerate, we fall back to a start-to-end bearing. From that seed, we generate a coarse sweep of 18 bearings around the full circle, each 20 degrees apart, all at a preferred pitch of 60.
For each candidate, we ask Mapbox for a camera that fits the route bounds at that bearing and pitch. We use adaptive padding based on canvas size, capped at 50px, so the safe frame scales with output size.
One detail that improved search quality a lot: after applying each coarse candidate, we recenter the route in screen space before scoring. That keeps the coarse pass focused on angle quality instead of letting small centering errors dominate.
We also lock the zoom after the first successful coarse candidate, giving us a fairer comparison across the sweep.
What We Measure
Each candidate is evaluated in screen space after projection. The magenta probe line (visible in the debug thumbnails below) lets us measure what actually survived rendering.
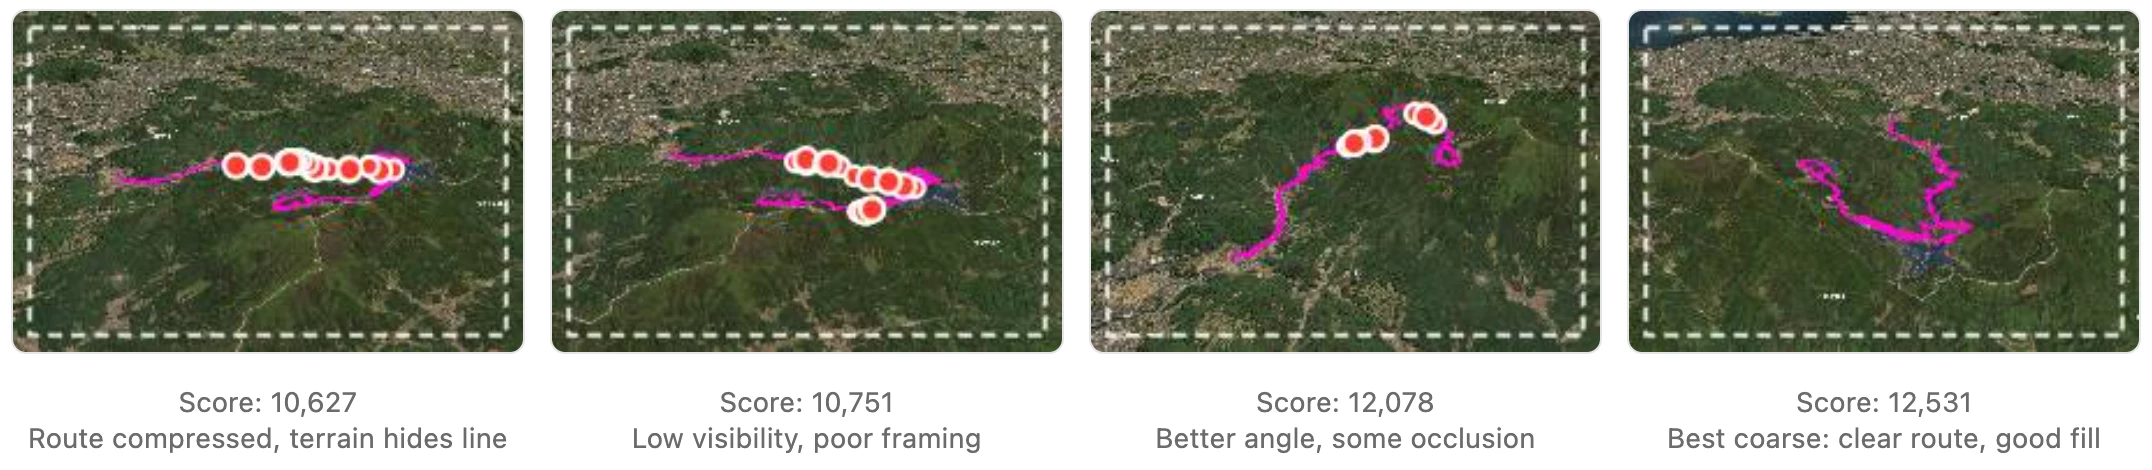
We sample points along the projected route at fixed screen-space intervals. At each sample, we look for the magenta probe color in a small neighborhood. This gives us the metric that matters most:
visibleSampleRatio
Visible route samples / total samples. Catches terrain occlusion that pure geometry misses.
onScreenRatio
Fraction of route coordinates inside the viewport.
footprintRatio
Route bounding-box area relative to the safe frame. How well the route fills the canvas.
insidePaddingRatio
Fraction inside the padded safe frame.
centerDistanceNormalized
How far the route center sits from the canvas center. Only applied after coarse search.
The Score
The current score is a weighted sum of visibility, framing, and composition:
score =
  (visibleSampleRatio * 3700 * coverageRewardMultiplier)
+ (onScreenRatio * 1400)
+ (insidePaddingRatio * 1100)
+ (min(0.78, footprintRatio) * 4200 * footprintRewardMultiplier)
- (centerDistanceNormalized * 950)
- (max(0, adaptivePadding - minMargin) * 30)
- (outsidePaddingAreaRatio > 0 ? 100000 : 0)
- (abs(candidatePitch - preferredPitch) * 8)
Visibility dominates. With the default coverage reward multiplier of 5, visibleSampleRatio is the strongest positive term. A beautiful 3D map is useless if too much of the route disappears behind a ridge.
We reward footprint, but cap it at 0.78. The route should fill the frame confidently, not win by overfilling it. And spilling outside the padded frame is effectively disqualifying: the 100,000 penalty makes sure of that.
Shortlisting and Tightening
After the coarse sweep, we rank candidates and keep a small diverse shortlist. Diversity means bearing separation. We keep candidates that are meaningfully different from each other rather than taking the top three near-identical views.
Each shortlisted candidate then goes through a tightening pass: zoom in by 0.18, recenter, rescore. Keep the new state only if the score improves and the route stays inside bounds. Repeat up to 8 times. The first time it gets worse or pushes outside the safe frame, we revert and stop.
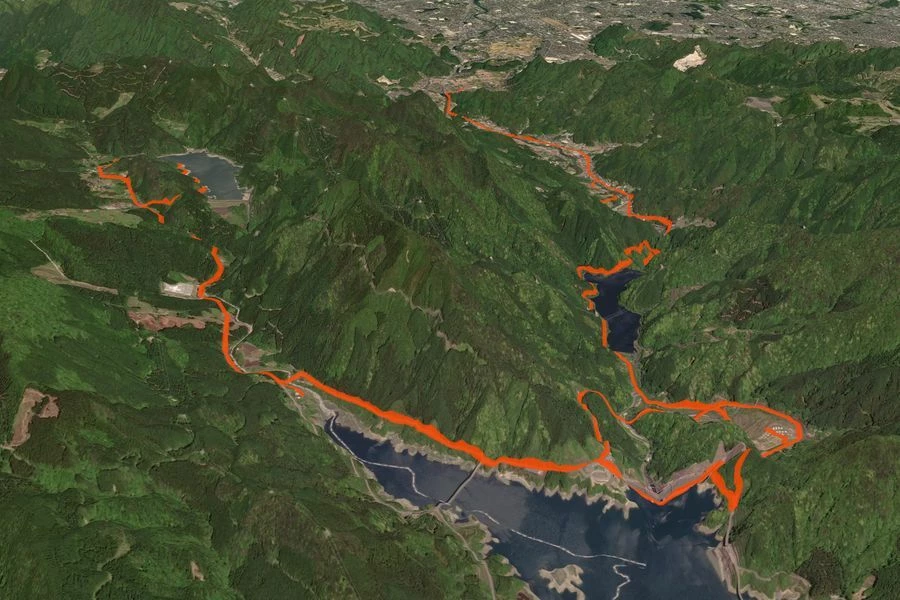
For the Fukuoka gravel ride above, the search evaluated 18 coarse bearings, shortlisted 3, and ran tightening on each. The final camera scored 13,772 with a visible sample ratio of 0.91. The worst coarse candidate scored 10,627.
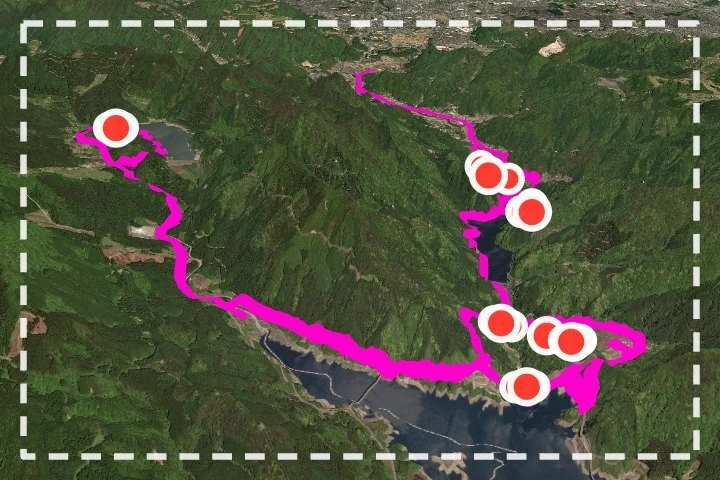
samples, red dots indicate occlusion.
Routes and Segments
This same camera search system runs on both full activity routes and individual Strava segments. When a user generates a 3D map from a segment, we use the segment polyline instead of the activity polyline. The rest of the pipeline is identical: coarse sweep, scoring, shortlisting, tightening. Segments tend to be shorter and more linear, which means the camera search often converges faster, but the scoring is just as important. A short steep climb viewed from the wrong bearing can look like a flat line.
Why This Matters
The athlete already did the hard work. Strava gives us the geometry. Our job is to find the view that makes that route read clearly as an object in terrain, not just as a line on a map.
That is why our 3D system is built around rendered visibility and weighted framing metrics instead of arbitrary camera presets. We are not trying to generate a plausible 3D view. We are trying to find the best one.
Mythic Maps transforms your Strava activities into AI-generated art. Try it at mythicmaps.ai or find us on Strava and Discord.