Did you know, you can use Strava's Relative Effort feature to analyze your efforts and intensity trends over time? If you are a Strava Subscriber and collect heart rate data for your activities, you can take advantage of this feature.
What is relative effort?
Relative effort, or RE, measures how much cardiovascular work went into any activity. You will see your relative effort score (a number) on your activity page on Strava.
Why is this useful?
It allows you to track your intensity across sport types, and see how they add up over the week, as well as how they compare over multiple weeks.
What does that number really mean? Is higher always better?
This can be pretty confusing, so let's look at a real life example of someone who benefits from using RE - me!

Up until a few years ago, my training focused almost exclusively on running and cycling. The metric I used to gauge my efforts was distance, and as a result I shied away from non-distance based activities like yoga and HIIT. I ended up over training and got an injury that took months to heal.
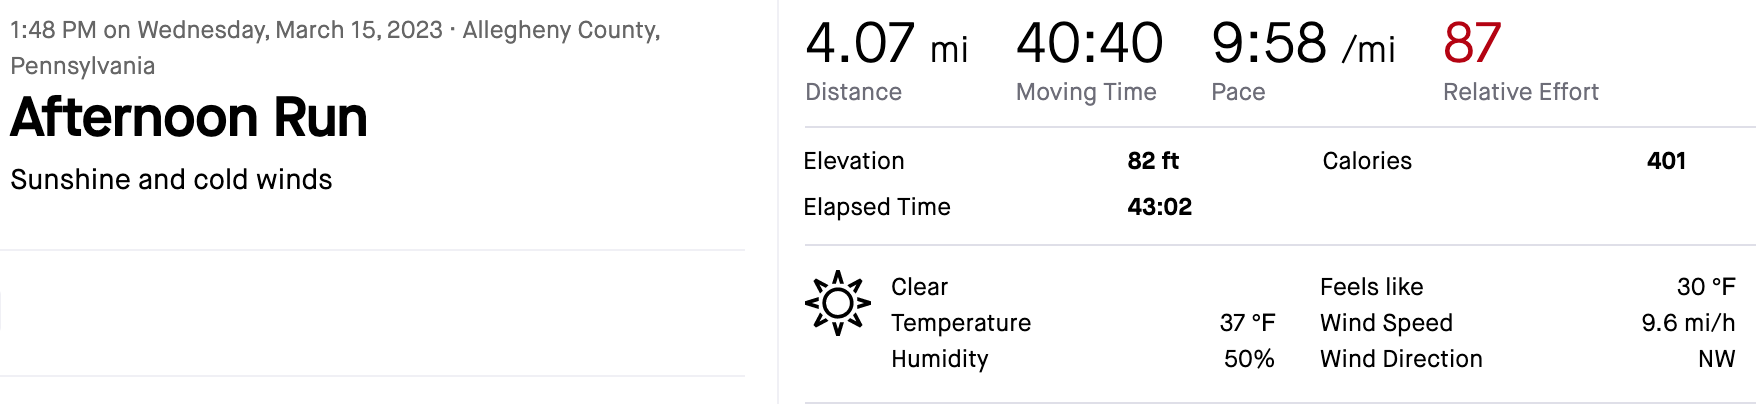
I started cross training, and using RE on Strava to compare and track my efforts across a diverse set of activity types. Take a look at my RE scores for the week of March 13th:
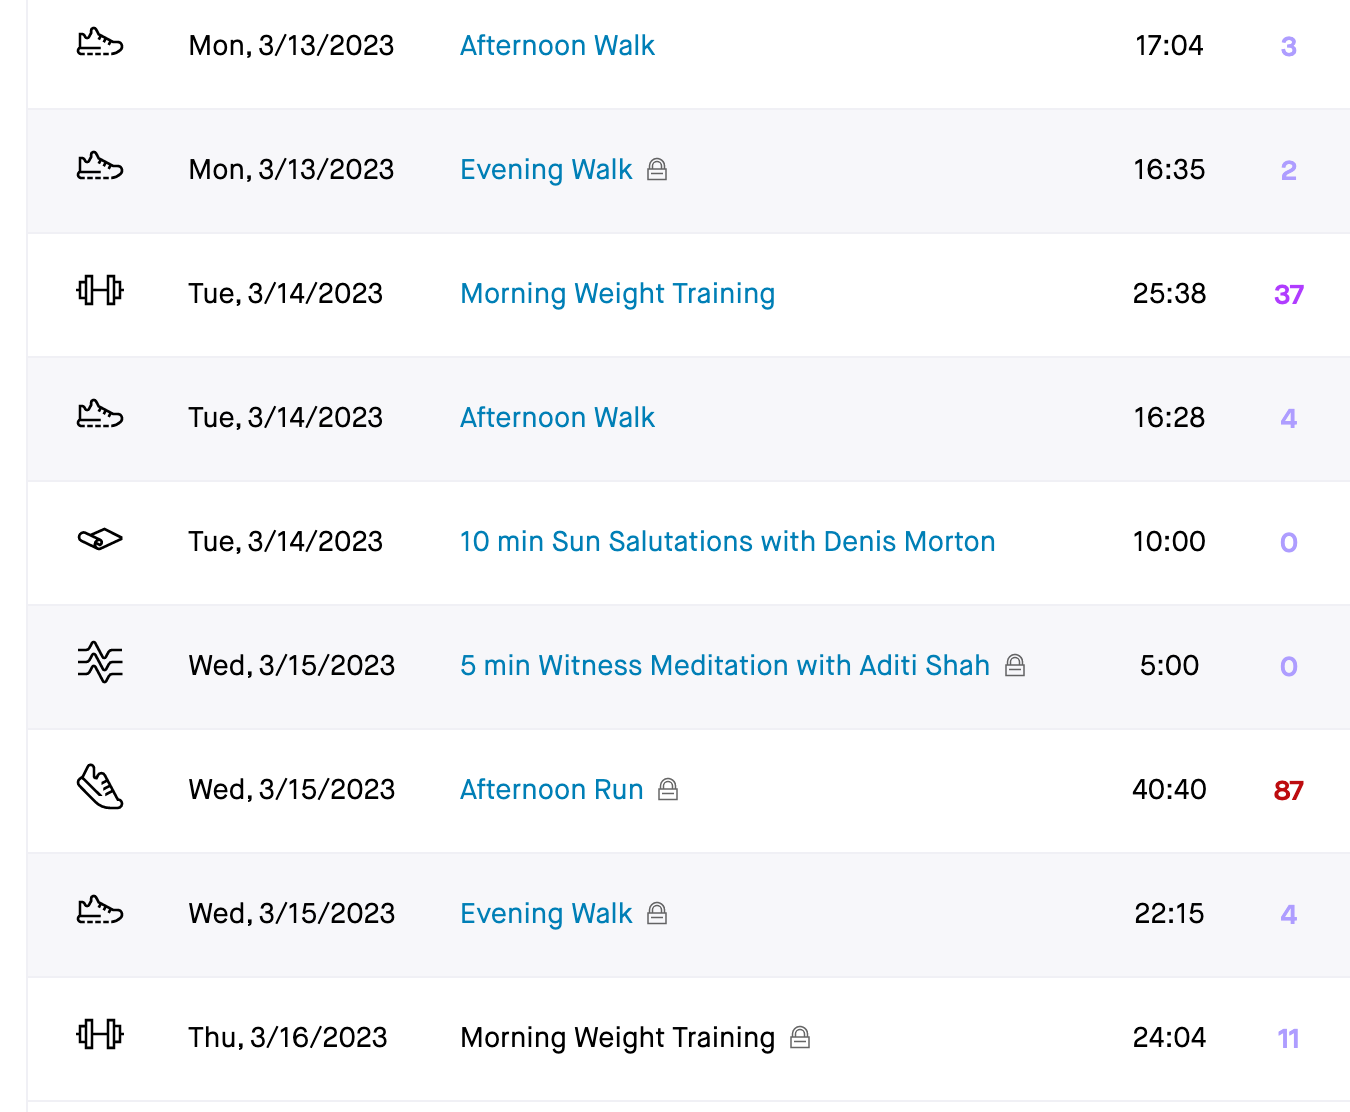
In this example, you can see that the run with the RE of 87 is the hardest workout I’ve done this week, followed by weight training with an RE of 37.
The important thing to remember about RE is that it’s, as the name suggests, relative. The number itself isn’t as meaningful as comparing those RE scores, to see where you’ve been putting in the hard efforts and where you’ve been taking it easier.
Assuming most of us shouldn’t be working out at maximum effort all the time, a higher RE score isn’t necessarily better. If you’re on a recovery day or week, you’ll be looking for those RE scores to be lower.
Are RE scores cumulative?
RE scores are cumulative and their total over a week makes up your Weekly Effort. If a week isn’t complete, you’ll see your total for the week so far. Below is my weekly effort chart with a cumulative RE of 250 so far this week:
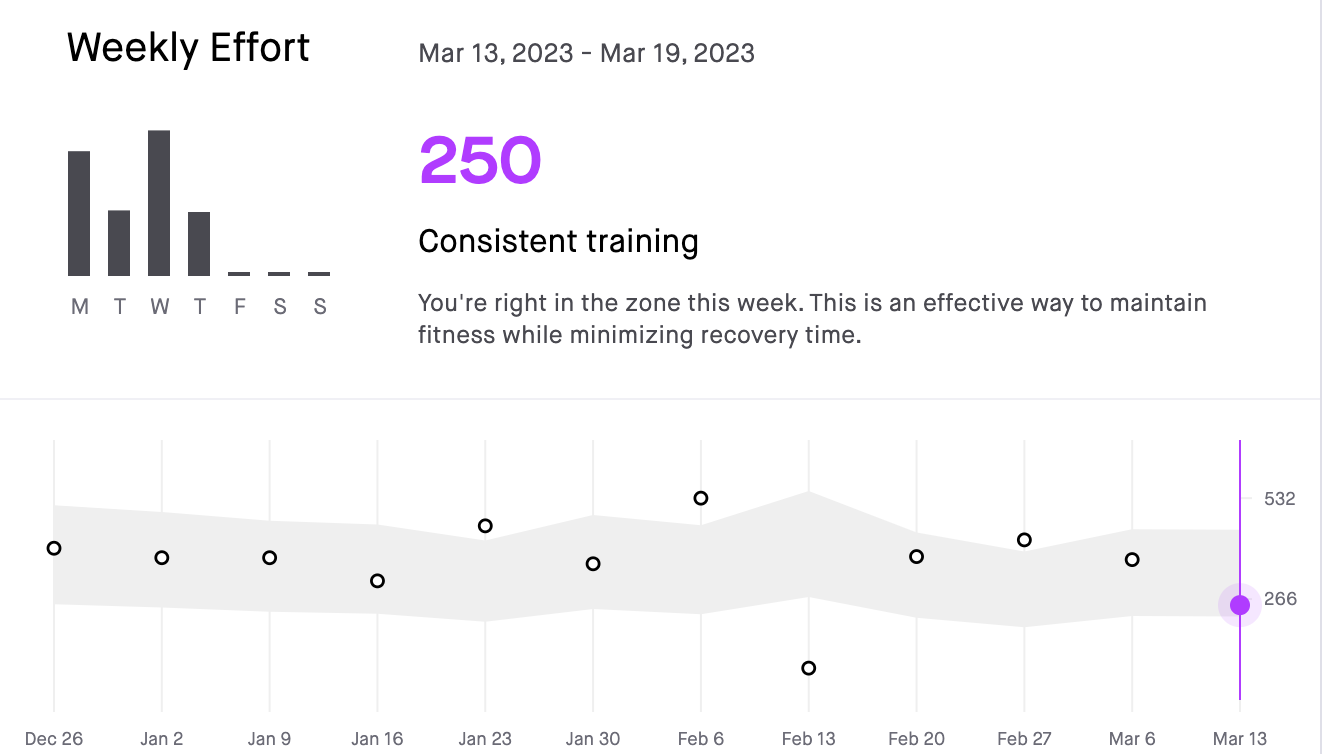
In addition to showing your weekly total, you’ll see a graph of previous weeks, so you can see how your RE totals are trending over time.
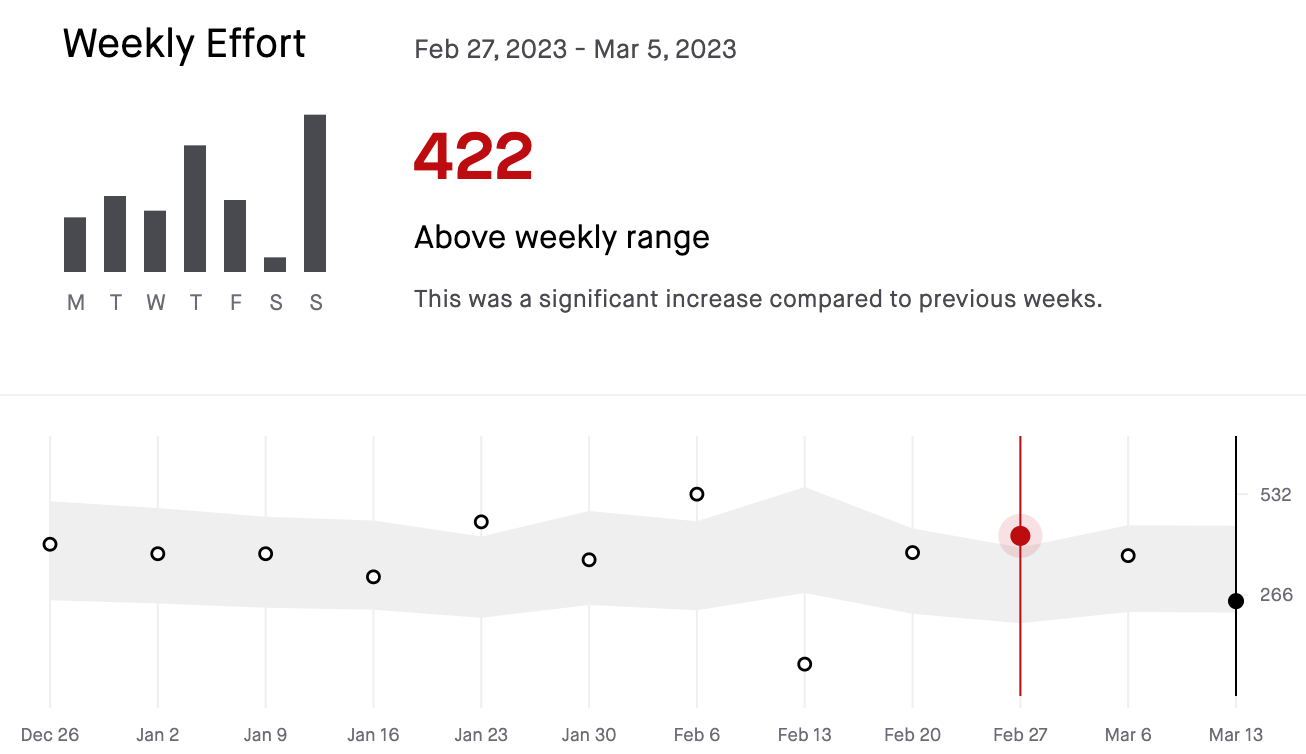
Here’s a week where I was working out pretty hard:
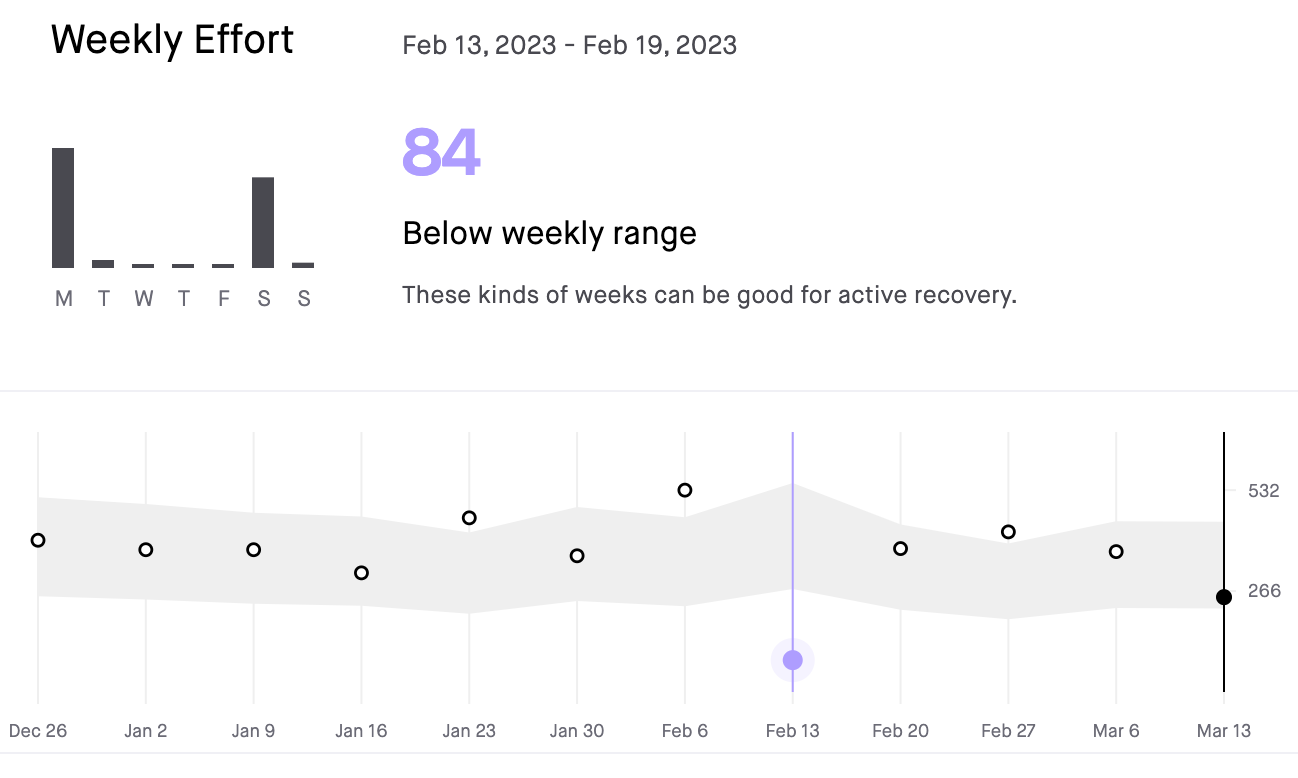
Here’s what a recovery week looked like:
By giving you the data you need to make appropriate adjustments to your training routines, comparing your RE scores over time can help you avoid both over or under training,
Frequently Asked Questions:
Q: I didn’t record heart rate for one of my activities. Can I still get an RE score?
A: Yes - for activities without heart rate data, you can set your perceived exertion to get RE.
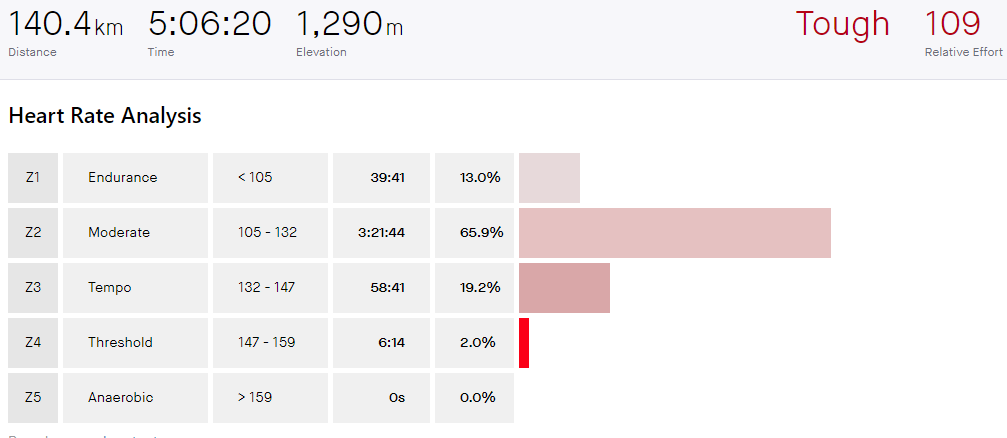
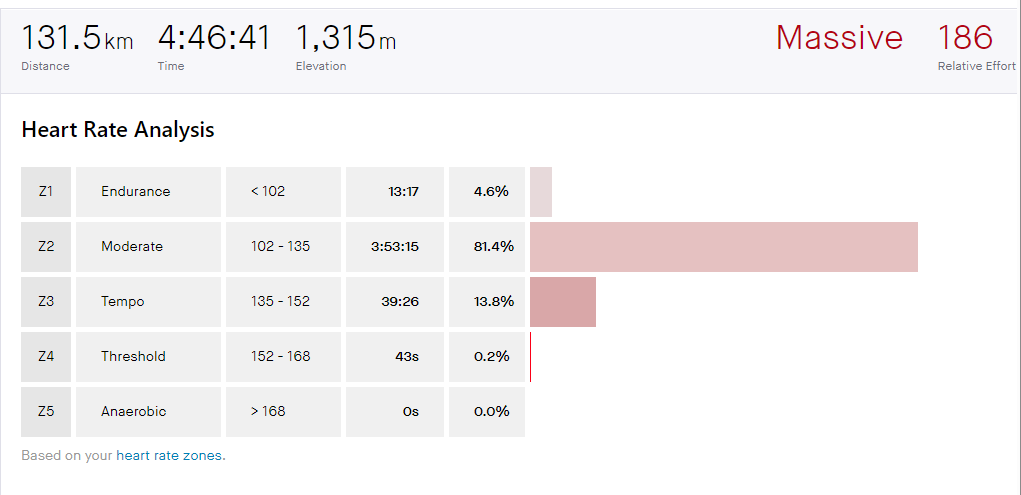
Q: I did a very long endurance activity, and my RE score seems too low. Why is this?
A: In many cases, very long activities (think an 8 hour hike) are done at a lower intensity. Since RE is calculated by how much time you spend in each of your heart rate zones, long activities spent in lower heart rate zones will have a much lower RE than shorter activities done in higher zones.
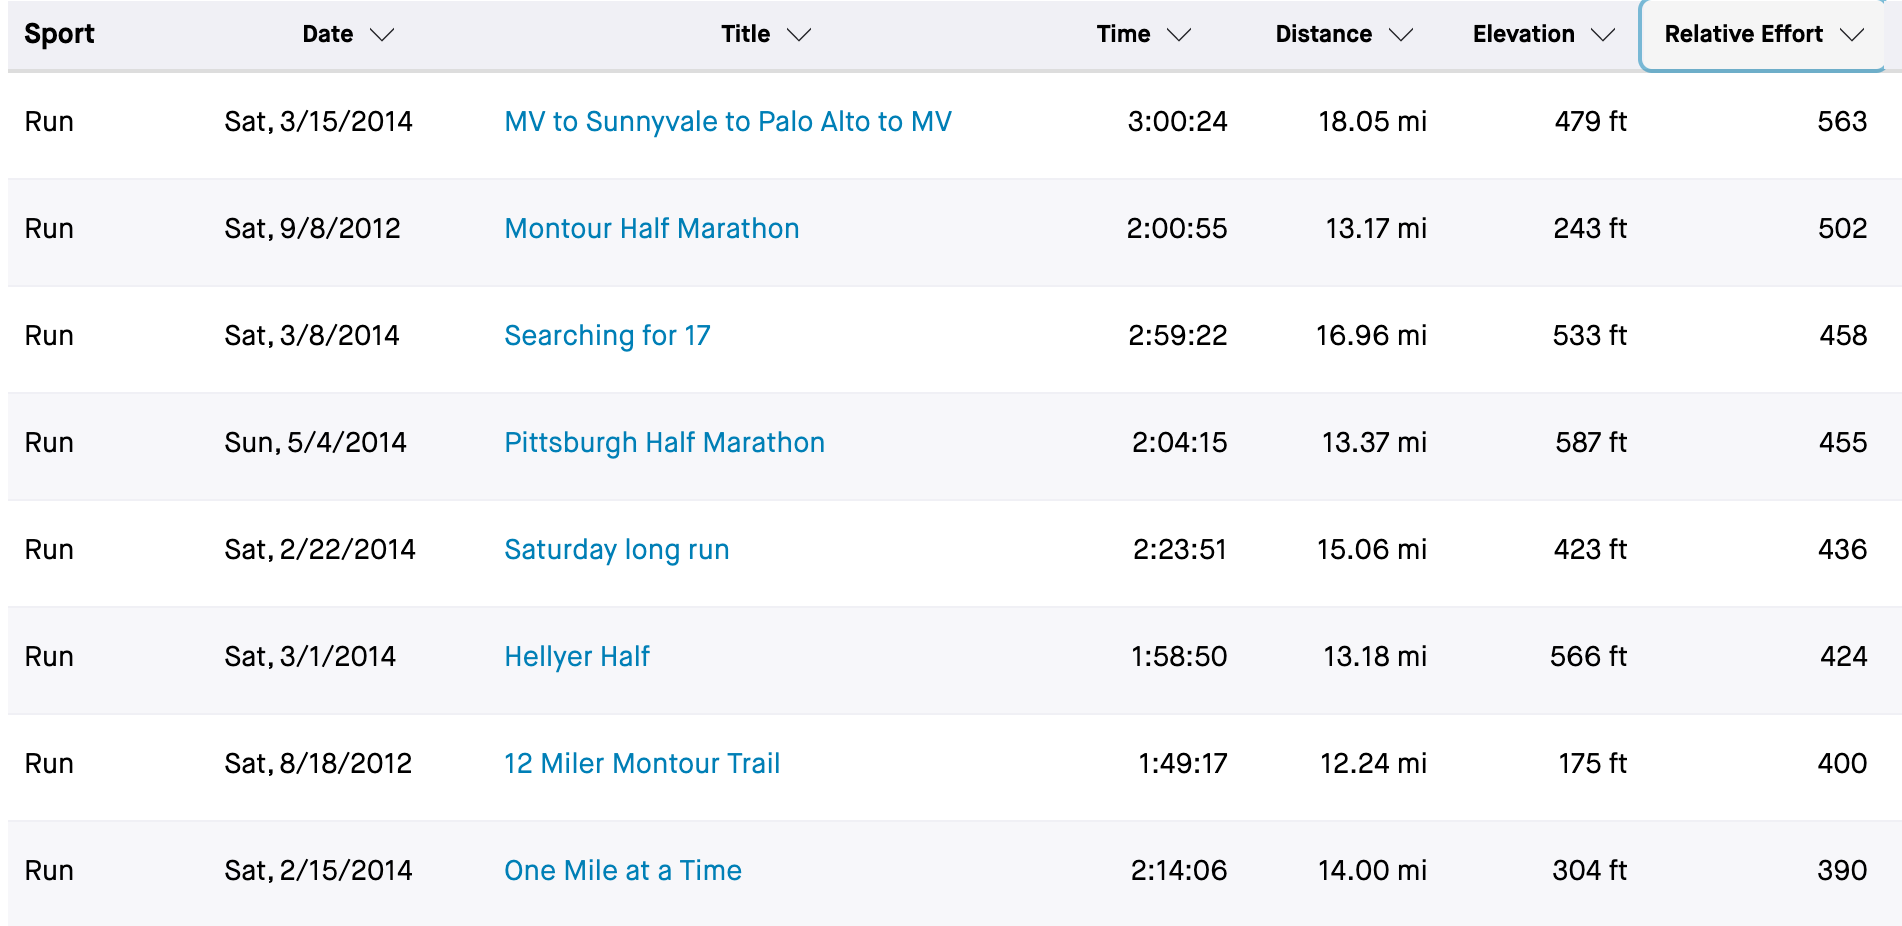
Q: Is there a way to see my hardest activities ever? The ones with the highest RE scores?
A: Yes - visit strava.com/athlete/training and sort your activities by RE. Your hardest efforts will appear at the top and will be sorted in descending order.
What if I have more questions?
Drop us a reply below and we’ll be happy to help.
Already using relative effort? Does it help you in your training and fitness? We would love to hear your experience.