
We are a developing an app for our e-bike systems.
Our app allows users to configure settings and navigate, for example.
We are in the process of releasing a new feature that will enable our users to track their rides.
These rides allow us to display average values within our app, and we also offer the option to download a .fit file, which can be imported into platforms like Strava. We have several customers who also use Strava, and we naturally want to provide them with the best possible data.
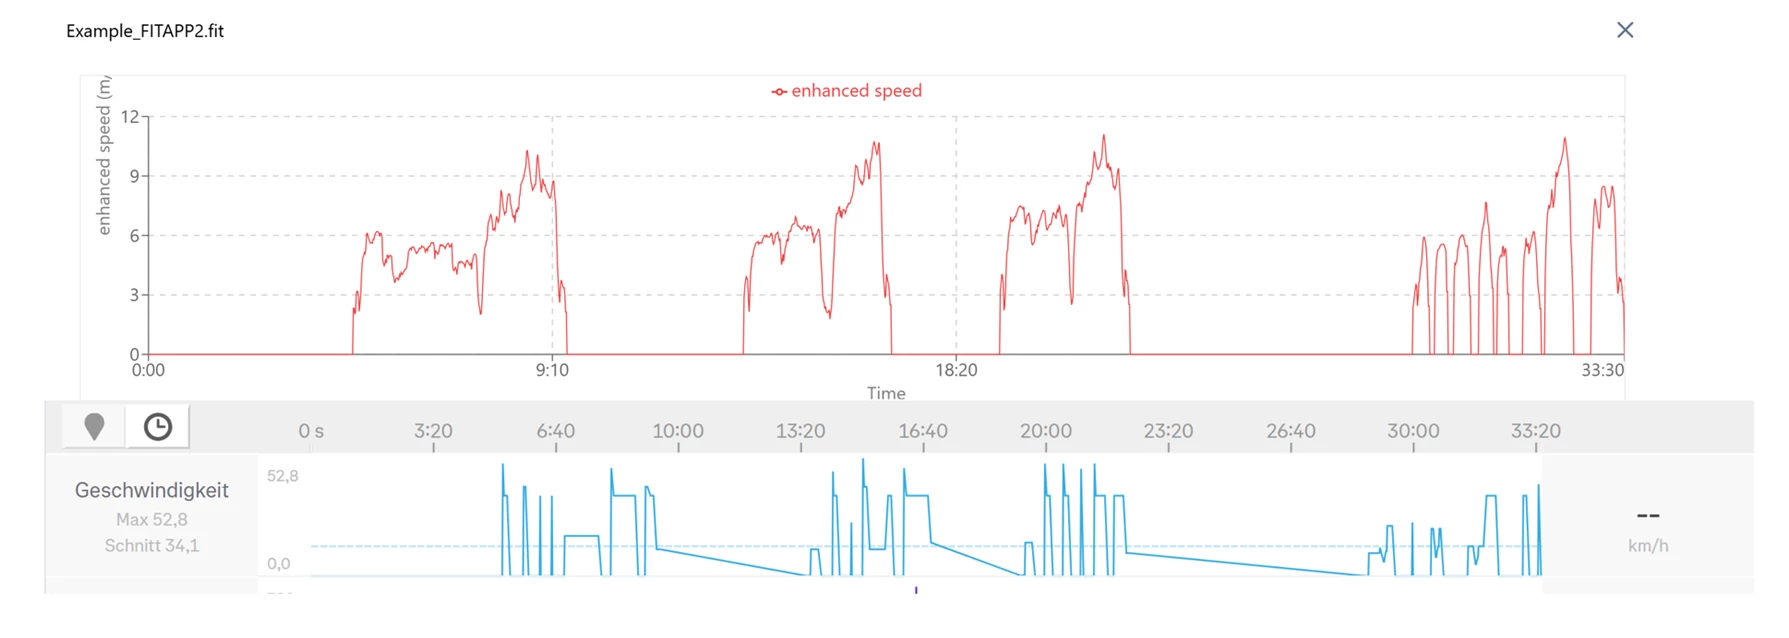
However, we have encountered an issue: when the .fit file generated by our app is uploaded to Strava, the speed data in the analysis appears unusual or incorrect.
Our recording method is relatively straightforward: we begin recording as soon as the bike speed is greater than zero, and we save the data every second, also the GPS Data in the same way.
My primary concern is to understand what we might be overlooking in the .fit file and why these discrepancies appear, particularly in the diagrams.

generating fit-file in our app for Strava
Best answer by ActivityFix
The Strava data shows that there are several points where speed goes to 0. I would suggest you check the GPS coordinates and timestamps in your FIT file. I think Strava calculates speed (and distance) based on the GPS data, so if there is a problem with that it would explain why you see such a difference. Over the course of the activity the average speed and distance are probably close to correct since it seems that there is some valid data so the course and time are correct, but there may be a problem with some of the intermediate data points causing all of the low and high speeds you see instead of smooth data.
For example, if you have a 100m segment where you were moving at a constant speed of 10m/s, you would have 10 data points (one point every 10 meters at a data interval of 1 second). If you had problems with the intermediate data points, maybe you have two points at 10m (still 1 second apart), and then another at 30m, etc… Over the 100m segment you will still have 10 points so your average speed will be correct, but you’ll see inconsistent speed data.
               1   2   3   4   5   6   7   8   9
Distance:  0...0...2...0...0...0...0...0...0...0
Good Data: X   X   X   X   X   X   X   X   X   X
Bad Data:  X X X       X   X X     X  X    X   X

Login to the community
No account yet? Create an account
Enter your E-mail address. We'll send you an e-mail with instructions to reset your password.