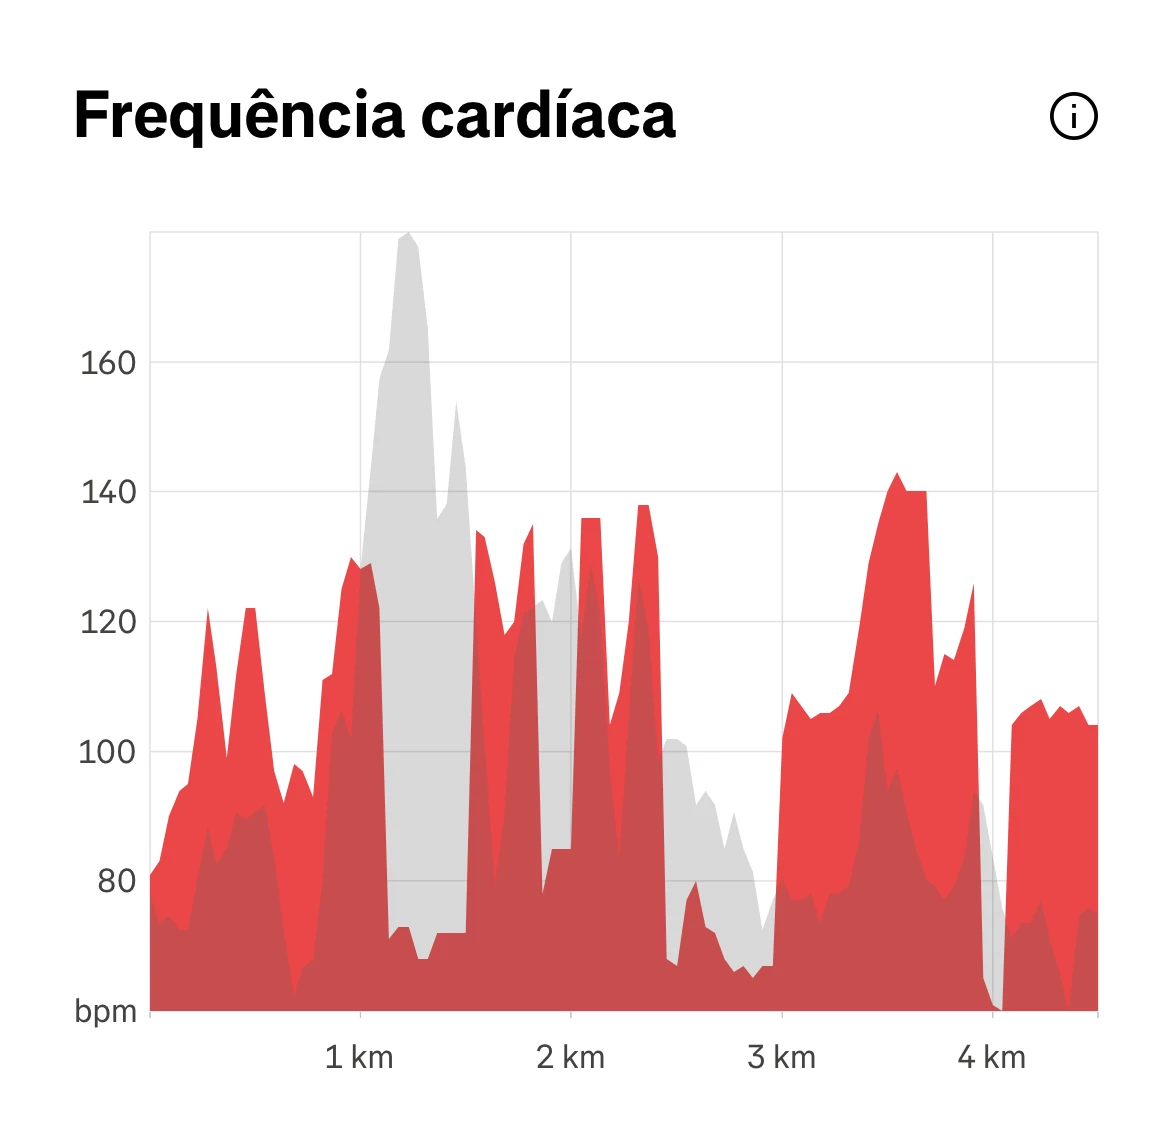
Please, could someone help me to understand the chart attached.
what does it means the gray and red chart?
during the exercise my watch does not measure the heart rate and i think that the gray is the beating during these moments. Is that?

 +1
+1Please, could someone help me to understand the chart attached.
what does it means the gray and red chart?
during the exercise my watch does not measure the heart rate and i think that the gray is the beating during these moments. Is that?
Best answer by Jana_S
Hi
the grey part is the elevation - it looks like you went up a bigger hill at around the 1st kilometer, then mostly downhill, and then some smaller climbing towards the end.
The red part is the heart rate.
Both elevation and heart rate are displayed on the same graph as the heart rate gets significantly higher when climbing up a hill - so the overlay is giving you a context.
Enter your E-mail address. We'll send you an e-mail with instructions to reset your password.
