

The first line of VeloViewer code
The first line of VeloViewer code was written in early 2012 after I was introduced to Strava by a cycling club-mate. Strava was a new and exciting platform, and I quickly became obsessed with trying to bag local KoMs. Soon after, I discovered Strava’s API and I couldn’t believe the extent of the dataset that was available. I wanted to refresh my web development skills having spent many years focusing on application development and this was the perfect opportunity.
The early days of fighting over local KOMs gave me the idea to build a fully filterable list of all my Strava segments and their current positions so that I could easily see how many podiums, top 10’s, top 50’s I had. My club-mates soon wanted access and before long, word spread via various cycling forums - including a very keen group of Norwegian cyclists who were early adopters. I undertook the first of many rewrites of the core syncing process due to the growing demand. Right from the start I was exploring what the Strava API could provide, looking to see how a user’s large dataset could be summarised in inspiring and novel ways. Communication with the Strava API team was very supportive, and this encouraged me further.
Early functionality, and burning the midnight oil
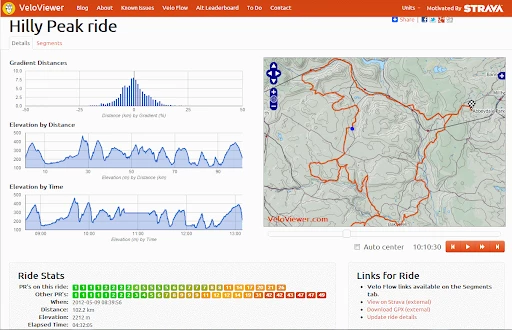
Historically, my development skills were in user interaction, information architecture and data presentation. By 2013, the evenings after my day job were filled with coding-up every way I could think of to visualise my cycling history in new and interesting ways. I started by creating the "VeloViewer Score" using segment performance statistics. I also looked for ways to provide value, insights and motivation for users whose primary interest wasn’t performance related. This included Eddington numbers, distance/elevation/time awards, and maps that help people to reminisce about past adventures and provide inspiration for future trips.
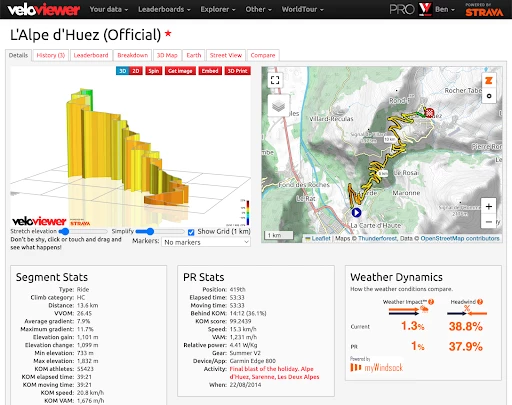
I wanted to improve the standard 2D profiles as they fail to capture the character and scale of climbs, for example, they can look almost identical for a 500m ramp and Alp d’Huez. Memories of 1980s arcade rally driving games that show a little 3D preview of the courses gave me an idea of what I wanted to achieve. I created code, tested it on a local road and this became the first 3D profile. When I swapped the segment id to that of Alpe d’Huez there was a jaw-dropping moment as the 21 hairpins of the Alpe appeared on the screen. I immediately shared the profile image on social media but had to do a very quick fix when a keen-eyed user pointed out that it was facing the wrong way! The 3D profile feature was the catalyst for VeloViewer’s involvement in professional cycling.
A leap of faith
By 2014 I was still in full time employment, but I was spending every spare minute building and supporting VeloViewer. The server hosting costs were covered by generous user donations, but to continue supporting the site we knew that we’d have to start charging for access in order to allow me to reduce my ‘day job’. My wife Anna (VeloViewer Co-Director since inception) and I had long discussions weighing up the potential risks and benefits of charging users. On 11th November 2014 at 2:20 am I flicked the switch to show the payment buttons hoping firstly, that my code would work, and secondly, that people might be prepared to pay. I started being able to wind down the day job, and within 12-months I was working full time on VeloViewer. To this day, I am incredibly grateful to those early supporters who enabled me to take that leap.
The advent of Explorer Tiles
Cycling has always created a sense of freedom and exploration for me and I wanted to try to bring that way of riding into VeloViewer. I was keen to find a way to encourage people to explore new places, and also provide a means of recording and rewarding the adventurous spirit. In 2015, after a few false starts, the concept of VeloViewer Explorer Tiles emerged; the entire world is split (very roughly) into a grid of 1 mile squares. Each square can be ‘ticked off’ which gains points. Of all the features I’ve built in VeloViewer, Explorer Tiles (and their resulting Max Squares and Clusters) is the one I’m most proud of, especially when we hear how it has provided motivation to get out and discover new roads, trails, sights and experiences.
Going Pro - WorldTour package
For a long time I had been sharing 3D profiles for bike races in real time just before the riders began the main climbs. Strava has the best elevation data set in the world which means the gradients in the VeloViewer graphics are very reliable - something that really matters to professional teams! This coupled with the iconic 3D curves of the climbs provides real value for professional race stakeholders. The 2015 “La Classicissima” showed VeloViewer 3D profiles for the Cipressa and Poggio climbs in the Eurosport live coverage. It was quite a moment seeing VeloViewer profiles on the TV alongside Geraint Thomas in the (sadly doomed) breakaway.
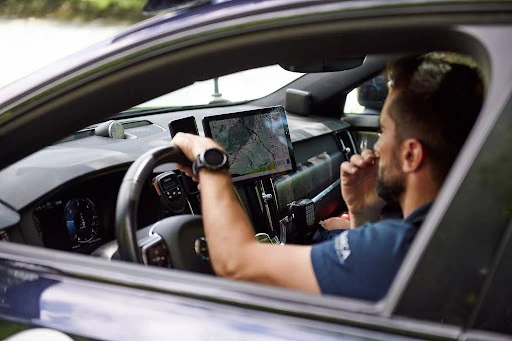
VeloViewer began gaining traction among professional teams, this visibility opened doors for new connections and helped shape the WorldTour package. In 2016 VeloViewer became an Official Supplier to Team Sky, and today the VeloViewer WorldTour package is used in almost every race vehicle at the most prestigious cycling events around the world. The WorldTour package is based on the same VeloViewer Route Details page that people use to view their own Strava Routes. We have always felt that the two arms of VeloViewer (individual pro-subscriptions and the WorldTour package) really complement one another - we love the fact that VeloViewer enables everyday cyclists to use the same tools as the best pro riders in the world.
What’s next for the VeloViewer team?
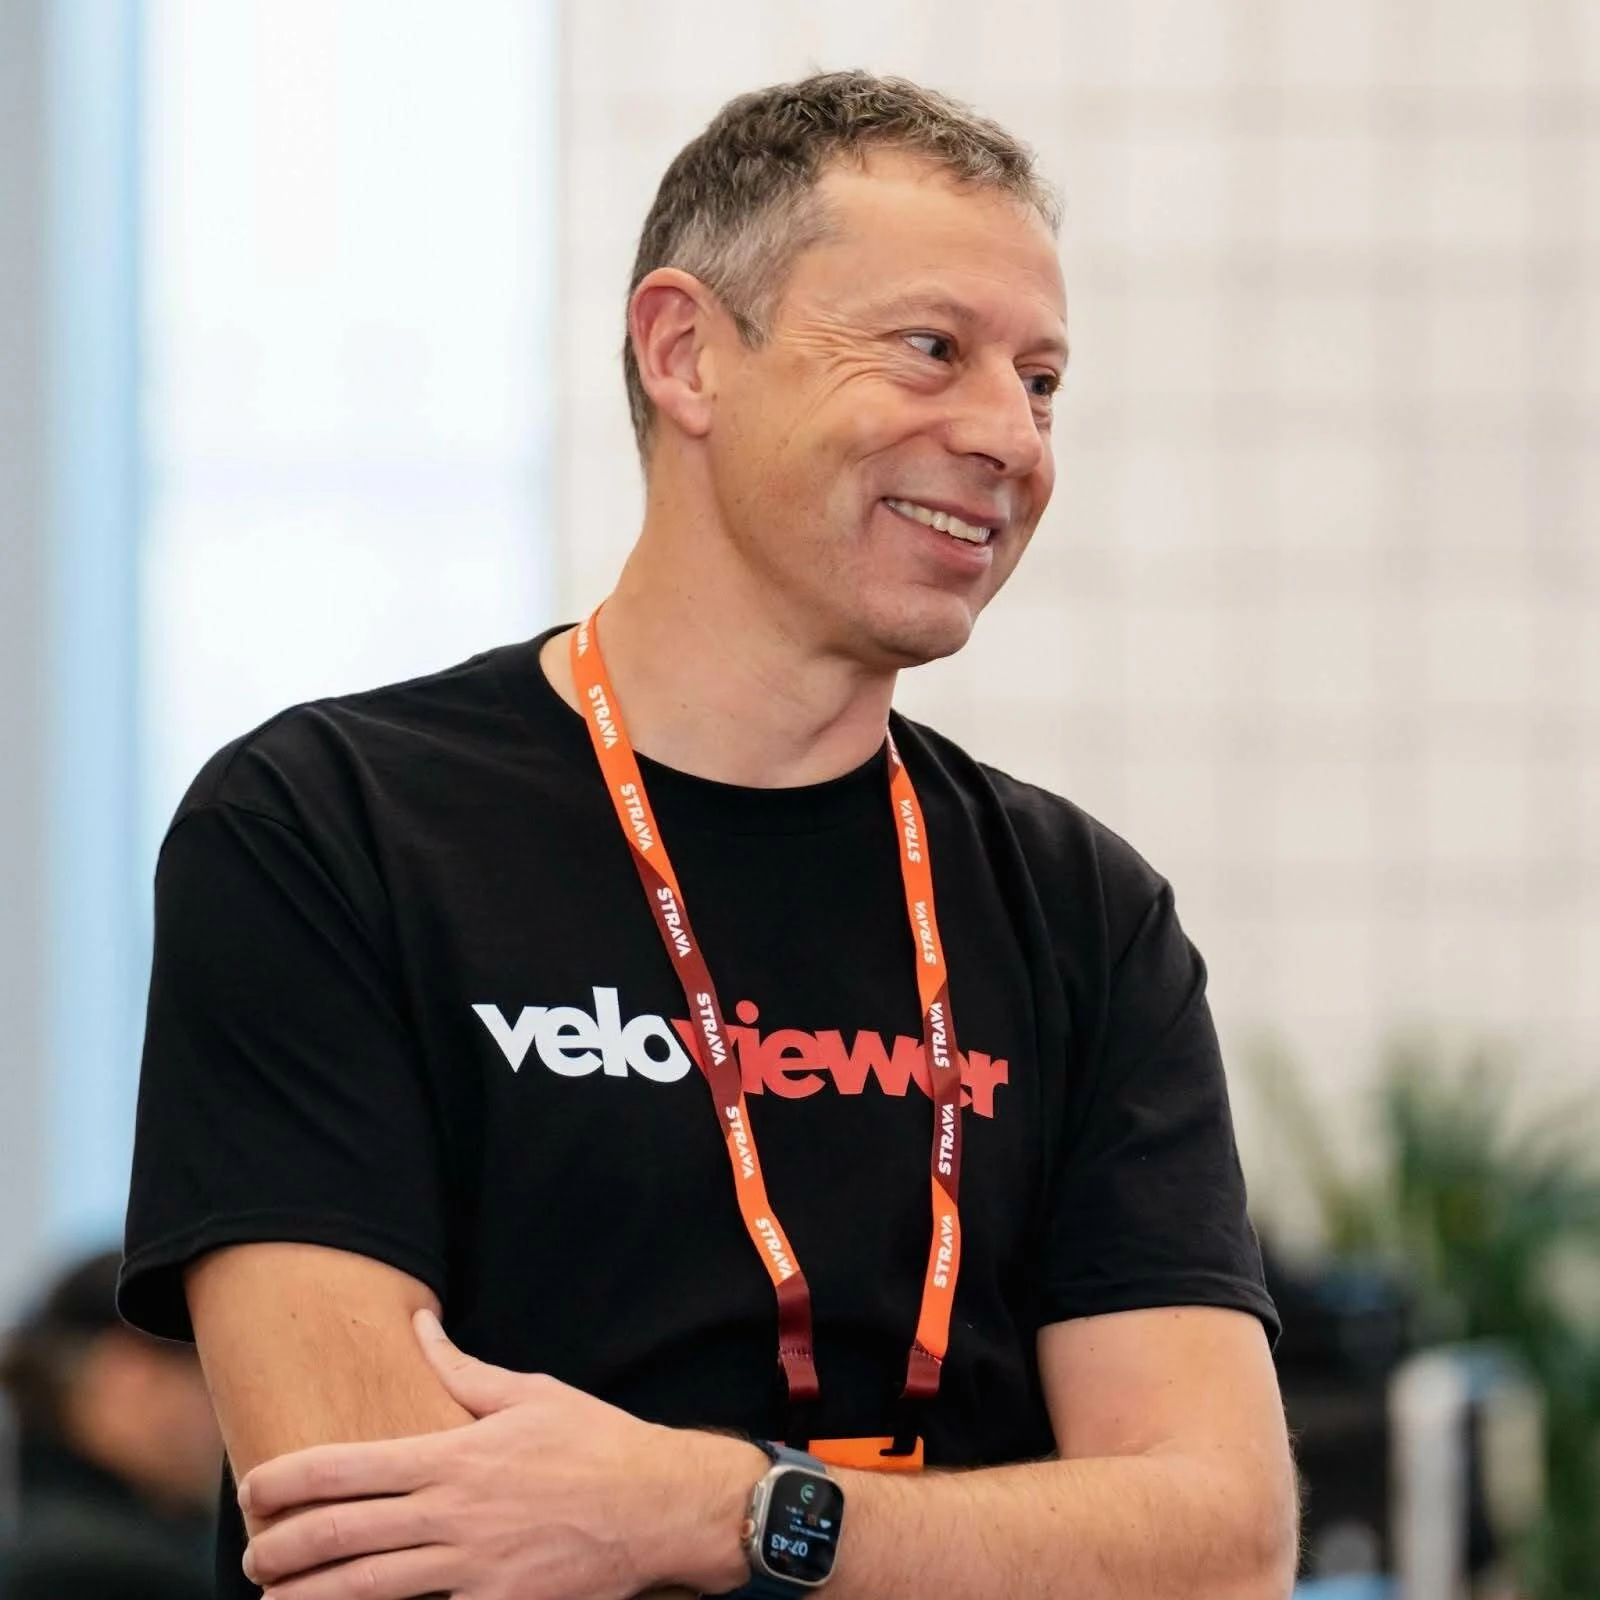
We have always tried to keep our infrastructure incredibly lean; we keep our overheads as low as possible and VeloViewer is made up of just four people. Alongside me, there’s Rachel, our Office Manager who communicates with hundreds of teams and race organisers. Lucy manages our comms, and Anna manages partnerships and strategy. I try to keep as much time as possible for coding; it is still that part that I enjoy the most.
Pro subscribers are always full of novel ideas for future developments, and they provide much of the inspiration for our future direction. In parallel, we are working with professional teams and race organisers to further develop the WorldTour package. We have a deep interest in race and rider safety, and we are exploring this with a range of stakeholders. The ideas and innovations that we see at WorldTour level drive developments across all aspects of VeloViewer and our pro subscribers benefit from this work.
We are excited by Strava’s renewed commitment to supporting its developer ecosystem; this enables us to connect and learn from others, and to weave together an offer that is valued by recreational cyclists and Grand Tour winners alike. The VeloViewer community has always been incredibly generous in providing inspiration, guidance and support - our loyal community shapes everything we do, and we are excited to see how this grows and evolves.
Find out more about VeloViewer here: