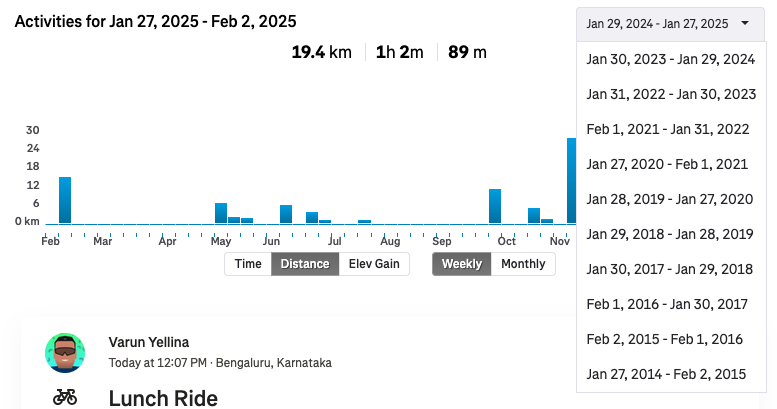
The activity filter shows options for 1 year at a time. Selecting one of them only shows the recent month. You can see in the screenshot, it is showing data for a 5 days when the filter is selected for an entire year i.e, Jan 2024 > Jan 2025.

The activity filter shows options for 1 year at a time. Selecting one of them only shows the recent month. You can see in the screenshot, it is showing data for a 5 days when the filter is selected for an entire year i.e, Jan 2024 > Jan 2025.
Best answer by Bryant
Hey
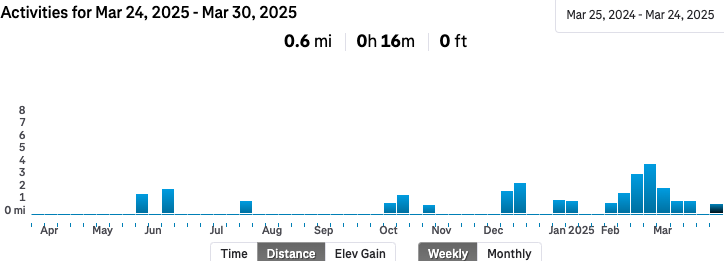
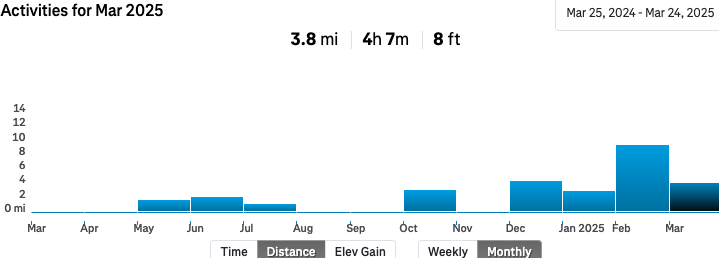
Within your screenshot the “Weekly” tab is selected. If you select “Monthly”, you’ll be able to view a monthly bar graph.
View the difference between the two tabs below.
Enter your E-mail address. We'll send you an e-mail with instructions to reset your password.