Activity views different


Forum|alt.badge.img+1

Strava browser web view is archaic and hasn’t changed in 10 years or more!

  1. Does Strava have any plans to update this view and make it match the more modern Android app data display?
  2. How do I make heart data always display in web view?
  3. Mousing over the graph below the map in webview is the only way to obtain certain data, such as the current BPM or the starting/ending minimum heights.  However, the resolution is poor, with a spacing between data points of about 15 seconds.  This is unacceptable.
  4. 4. When mousing in webview, it is difficult to control the mouse in small increments.  Should be able to use the cursor keys to move left/right in 1 second increments.
  5. Splits should show average and max BPM, if available.
  6. Webview shows the moving time and pace but not the average speed.
  7. “Elevation” should be changed to “elevation gained”, otherwise people might confuse the number with max elevation.

13 replies

Jan_Mantau
Superuser
Forum|alt.badge.img+26
  • Superuser
  • 942 replies
  • November 17, 2024

About what activity type is that? At least for riding the heart rate is always properly displayed in the web view. But for running and probably every other activity type you are absolutely right, the graphs are below mediocre. In the end I would rather propose to harmonize them to the ride layout instead of the android app layout because I want the large screen to be used instead of having to scroll.


Forum|alt.badge.img+1
  • Author
  • Hub Rookie
  • 6 replies
  • November 25, 2024

Thanks for contributing.   I wonder why I don’t get any notification that someone posted a reply?

And of course, as usual, Strava representatives refuses to participate in their own forums and have not replied to my concerns.  Has anyone from Strava even read my post?

I wish someone would buy Strava who was more committed to their users.


Jane
Forum|alt.badge.img+29
  • Strava Alumni
  • 3524 replies
  • January 24, 2025

Hi ​@Jo61jo 

Thanks for your post and sorry for the delayed reply. We definitely appreciate you taking the time to share your thoughts.  I've tagged this post as Product Feedback, so it can be reviewed and discussed by our Team.

In regards to your question about heart rate display in the Web view - can you clarify exactly what you mean? If you’re recording and uploading heart rate data, you should be seeing it on your Web activity page.

Thanks again for the feedback.


JBW-Florida
Forum|alt.badge.img+17
  • Hub Explorer
  • 150 replies
  • January 24, 2025

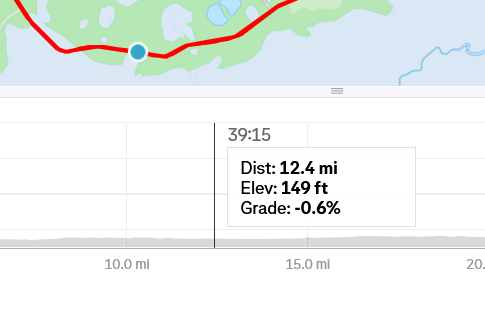
I can't speak for the original poster, but I think I know what he means.  In the graph beneath the map on the activity page, my heart rate does not appear when moving the cursor left and right.  Only distance, elevation, and grade appear... for each 15 second interval.  (And I think my Elemnt Roam records at one second intervals.)  Heart rate only appears in the segments.    


Forum|alt.badge.img+1
  • Author
  • Hub Rookie
  • 6 replies
  • January 28, 2025
Jane wrote:

Hi ​@Jo61jo 

In regards to your question about heart rate display in the Web view - can you clarify exactly what you mean? If you’re recording and uploading heart rate data, you should be seeing it on your Web activity page.


I’m unsure what exactly is not clear.  As I numbered my points, can you refer to the number?


Forum|alt.badge.img+1
  • Author
  • Hub Rookie
  • 6 replies
  • January 28, 2025
JBW-Florida wrote:

I can't speak for the original poster, but I think I know what he means.  In the graph beneath the map on the activity page, my heart rate does not appear when moving the cursor left and right.  Only distance, elevation, and grade appear... for each 15 second interval.  (And I think my Elemnt Roam records at one second intervals.)  Heart rate only appears in the segments.    

Your heart rate will not appear unless you check the heart rate display tickbox ON.  I believe the display of heart rate data should be on by default if it exists and not require being ticked on.


Forum|alt.badge.img
  • Hub Starter
  • 2 replies
  • January 30, 2025
Jo61jo wrote:

Your heart rate will not appear unless you check the heart rate display tickbox ON.  I believe the display of heart rate data should be on by default if it exists and not require being ticked on.

I don’t appear to have a check box

I looked in the code and the following section appears below the chart but is rather empty of options? :)

<div class="inline-inputs" id="chart-controls"></div>


Forum|alt.badge.img+1
  • Author
  • Hub Rookie
  • 6 replies
  • February 1, 2025
boars wrote:
Jo61jo wrote:

Your heart rate will not appear unless you check the heart rate display tickbox ON.  I believe the display of heart rate data should be on by default if it exists and not require being ticked on.

I don’t appear to have a check box

I looked in the code and the following section appears below the chart but is rather empty of options? :)

<div class="inline-inputs" id="chart-controls"></div>


I should have qualified that I am responding from Windows 10.  If you are on a MAC, then the UI may be different.  See attachment for what I see.

If you are on Windows and not seeing this in a browser window, then you may not be recording heart data.  You have to first pair a recording device with Strava.


JBW-Florida
Forum|alt.badge.img+17
  • Hub Explorer
  • 150 replies
  • February 1, 2025

Well, I’m on Windows 11 and before that 10, and I’ve never seen anything like that.  And a paying subscriber.  I’ll see if I can post a screen image of what I see when I click on the word “analysis” from the activity page.  


JBW-Florida
Forum|alt.badge.img+17
  • Hub Explorer
  • 150 replies
  • February 1, 2025

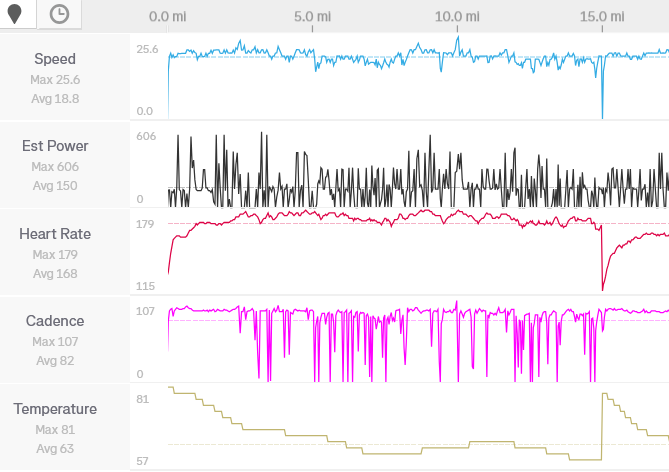
Okay here’s my “analysis” view: Speed, power, heart, cadence, and temp are always on, no tick boxes:


Forum|alt.badge.img
  • Hub Starter
  • 2 replies
  • February 3, 2025
Jo61jo wrote:

I should have qualified that I am responding from Windows 10.  If you are on a MAC, then the UI may be different.  See attachment for what I see.

If you are on Windows and not seeing this in a browser window, then you may not be recording heart data.  You have to first pair a recording device with Strava.


I too am on Windows, having said that there should be no difference between Chrome/firefox/safari on different operating systems - the toggle buttons are simply not being output in the code.

I too am subscribed. 

The toggle buttons don’t appear in the interface, they aren’t in the output html, they’re completely missing. Not just the heart rate, all of them.

I have HR showing up in other sections of the site and it displays correctly in the phone app too - it’s just missing the options from the graph on the activity view overview page, presumably this is the graph in question? I cannot find another graph anywhere that matches yours.

Missing any options to change:


JBW-Florida
Forum|alt.badge.img+17
  • Hub Explorer
  • 150 replies
  • February 4, 2025

This is what I see on the activity page when I move the cursor below the map:

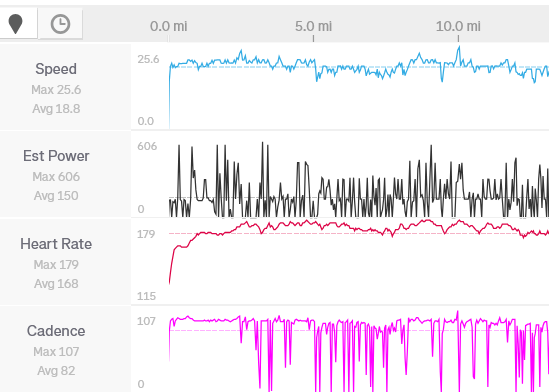
… heart rate doesn’t appear there.  And this is what I see when I click on the word analysis button:

 Heart rate appears… all without a check box or button.    


Forum|alt.badge.img+1
  • Author
  • Hub Rookie
  • 6 replies
  • February 5, 2025

Re: your first image where you mouse over the activity graph, I have found that if I don’t tick on the boxes like heart rate, then the mouse over will not display that data.

Are you possibly using an ad blocker than might be customizing what you see?

Otherwise, nothing further I can offer.  Since you are a paying customer, isn’t there support form Strava that you can avail yourself of?


Reply


Cookie policy

We use cookies to enhance and personalize your experience. If you accept, you agree to our full cookie policy. Learn more about our cookies.

 
Cookie settings