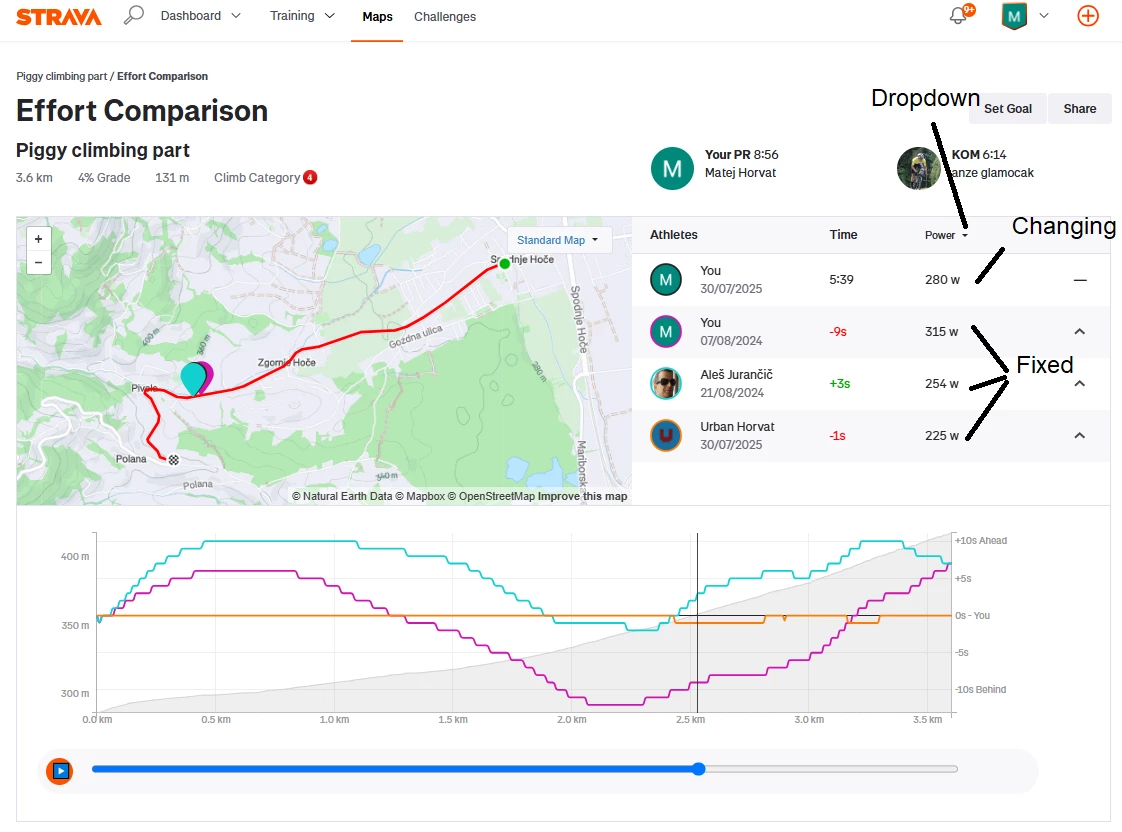
There is a great feature where you could compare those metrics (Speed, HR, power) of all selected athletes for each second by sliding through the timeline.
Approx. 2 weeks ago I noticed that this is brokwen so that the figures only update for reference athlete (the on on top of the selected list) while for all others it is stuck at one figure (average on the segment, I think)
Please fix this. This is really annoying and takes away a huge value in comparisson analyses.

Question
BUG report: Speed, HR and Power metrics in segment compare do not change when sliding trough timeline
 +1
+1

Login to the community
Enter your E-mail address. We'll send you an e-mail with instructions to reset your password.