One of my analysis on my own training is to look at my ride map and view it in power zones based on my selected FTP/Vo2max, when I look at power and heart rate in general its very difficult to see the strain on the effort, on my own Api I have done this at the top of the picture you can see the the power zone for each and including the FTP calculated, I have other options to filter segments and laps, also the time aggregated average so bunch the wattage every 20 seconds,30, 60, 2 minutes, thats what the sliders alow you to adjust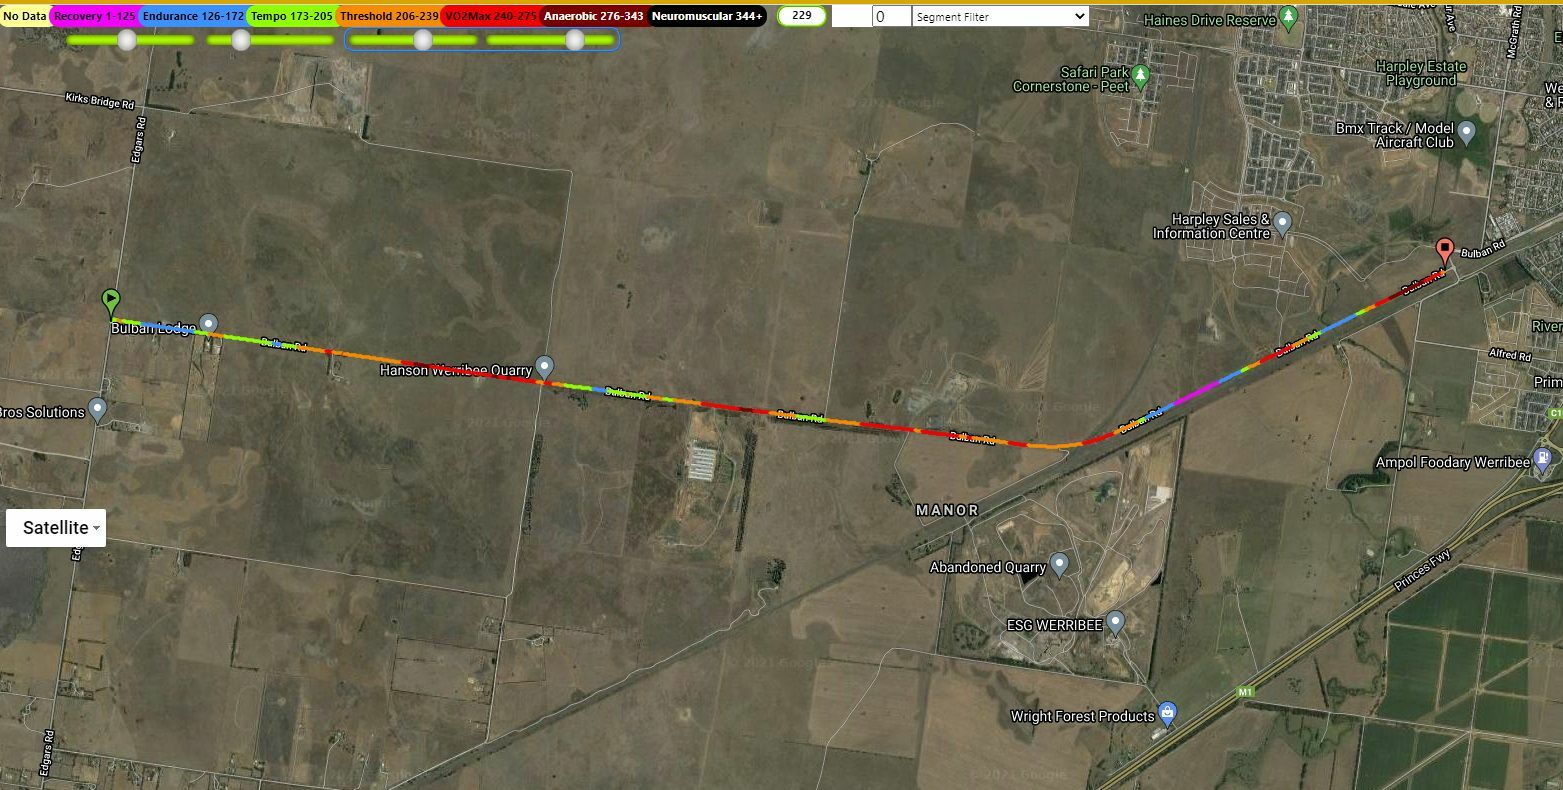

Power & Heart Rate Zones Map
 +15
+15
Login to the community
Enter your E-mail address. We'll send you an e-mail with instructions to reset your password.