cancel
Showing results for 
Search instead for 
Did you mean: 

Show resting or stops on a ride (activity)

dkc
Mt. Kenya

I am interested in analysing my stops post ride. I would like to see where I rested on an activity (this affects your efficiency percentage on long rides such as Audaxes, i.e. ride time vs rest time)

This can be where

  • the stop was more than 1 minute
  • no power or cadence registered
  • speed below 3km per hour (in case of a wandering GPS)

Ideally this would show in a table (similar to the existing Laps table) showing

  • the rest start time (time of day and ride time)
  • rest time
  • the end time for each extended stop

Even better if you could show these as locations on the activity map

Many thanks for reading and hopefully upvoting this idea.

1 ACCEPTED SOLUTION

Jane
Moderator Moderator
Moderator

Hello @dkc 

Thanks for posting!  On outdoor rides that are tracked with GPS, it's possible to see your stops on the analysis graph.  To do this:

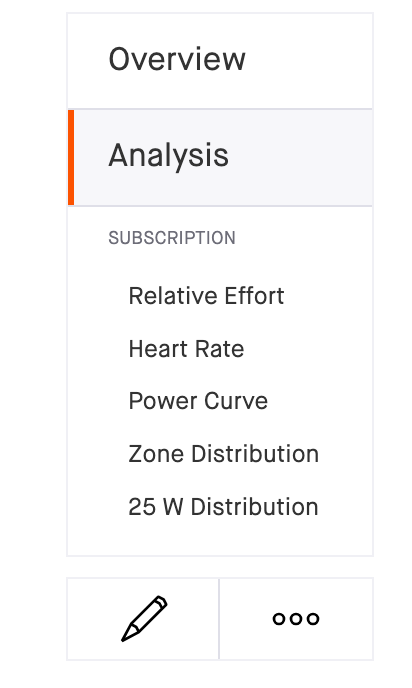
1.  Select the analysis tab on the ride page:

Screen Shot 2023-09-11 at 9.10.56 AM.png

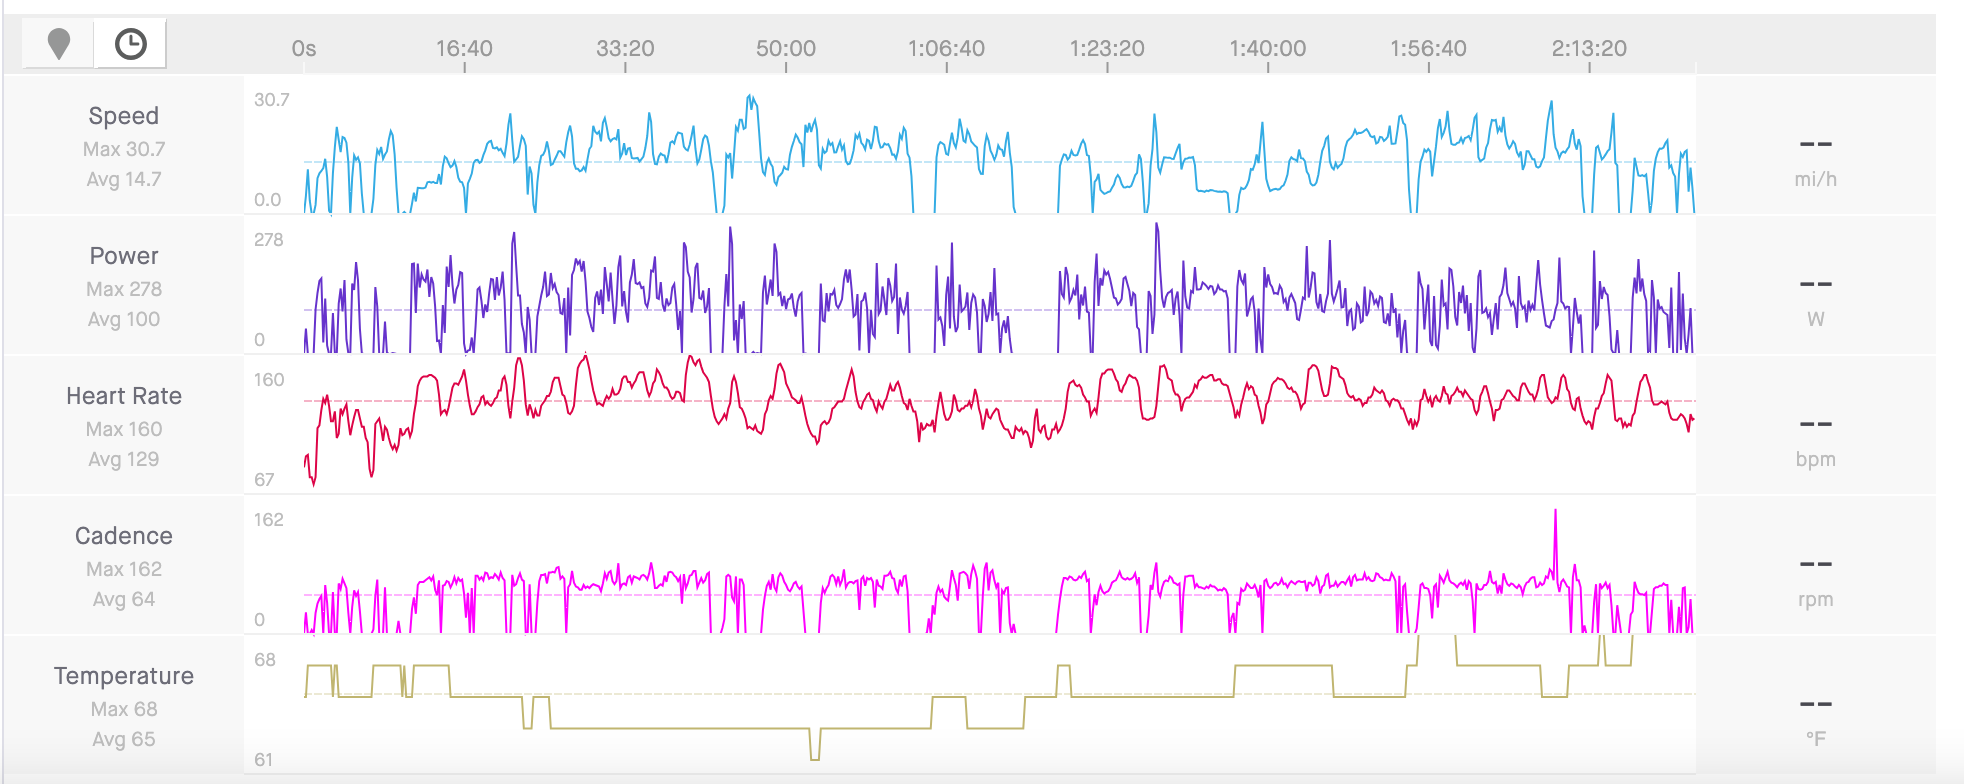
 2.  On the graph, sort by time (select the clock icon):

Screen Shot 2023-09-11 at 9.13.04 AM.png

You'll be able to see your points along the speed graph where your speeds are zero.  You can also mouse across to that point and it will show you were you were on your map.

Find out more about how we calculate stopped vs. moving time here.  


Jane (she/her)
STRAVA | Community Hub Team

View solution in original post

2 REPLIES 2

dkc
Mt. Kenya

Yes, that's what I've had to manually and to be honest it's been a PIA, which is why I made my request. Made event harder on a longer ride where there may be several stops. I do this regularly and presume many other Audax riders would want to do the same. 

Jane
Moderator Moderator
Moderator

Hello @dkc 

Thanks for posting!  On outdoor rides that are tracked with GPS, it's possible to see your stops on the analysis graph.  To do this:

1.  Select the analysis tab on the ride page:

Screen Shot 2023-09-11 at 9.10.56 AM.png

 2.  On the graph, sort by time (select the clock icon):

Screen Shot 2023-09-11 at 9.13.04 AM.png

You'll be able to see your points along the speed graph where your speeds are zero.  You can also mouse across to that point and it will show you were you were on your map.

Find out more about how we calculate stopped vs. moving time here.  


Jane (she/her)
STRAVA | Community Hub Team